influxdb
 influxdb copied to clipboard
Published
20 hours ago •
 influxdata
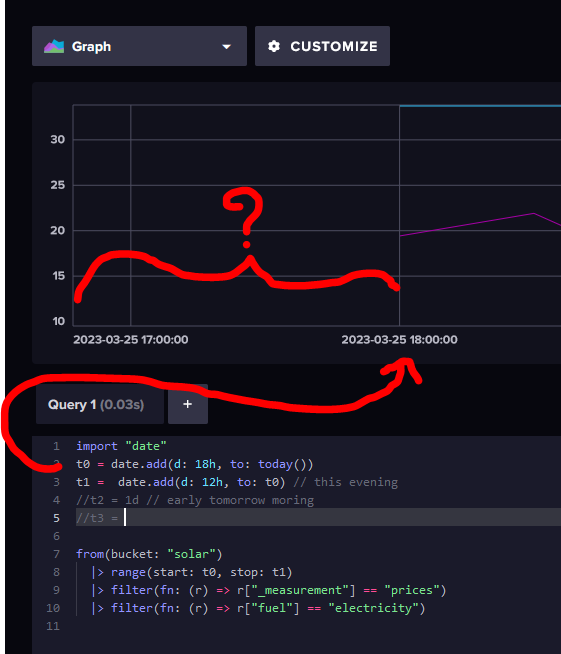
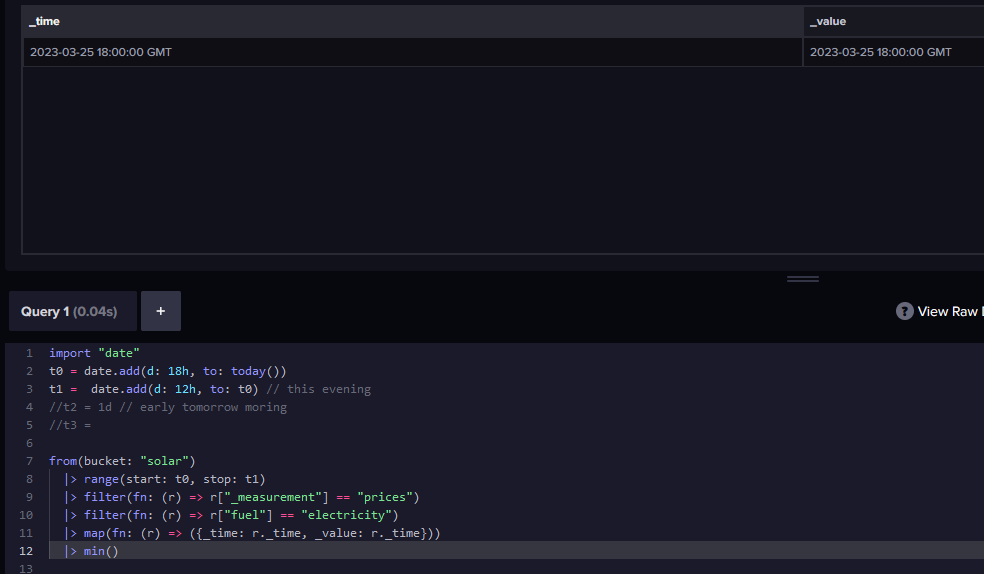
Range of x-axis on chart
The x-axis always ends at the time of the most recent data point in the bucket rather than in the result of the query.

I have a similar problem... did you find a solution in the meantime?
the X axis should end left of the red box. There is not a single data point in that red box, because the query only considers data points from "yesterday", i.e. until 23:59:59 GMT+1
import "experimental/date/boundaries"
import "timezone"
option location = timezone.location(name: "Europe/Berlin")
day = boundaries.yesterday()

from(bucket: "this_machine")
  |> range(start: day.start, stop: day.stop)
  |> filter(fn: (r) => r["...some filters...")
  |> map(fn: (r) => ({r with _value: float(v: r._value) / 6.0 }))
  |> aggregateWindow(every: 10s, fn: max, createEmpty: false)
  |> cumulativeSum()