holoviews
 holoviews copied to clipboard
Holoviews Plotly Backend on JupyterLab responsive=True does not work
ALL software version info
Tested on a minimal conda environment and jupyterlabextensions defined here: OS: WSL2 running JupyterLab, on Windows 10, where the browser (Firefox 86) is running.
- holoviews 1.14.2 pyhd8ed1ab_0 conda-forge
- plotly 4.14.3 pyh44b312d_0 conda-forge
- python 3.9.2 hffdb5ce_0_cpython conda-forge
- jupyterlab 3.0.10 pyhd8ed1ab_0 conda-forge
Environment and jupyter extensions install command
Rendered notebook with conda list and jupyter labextensions list at the end
Description of expected behavior and the observed behavior
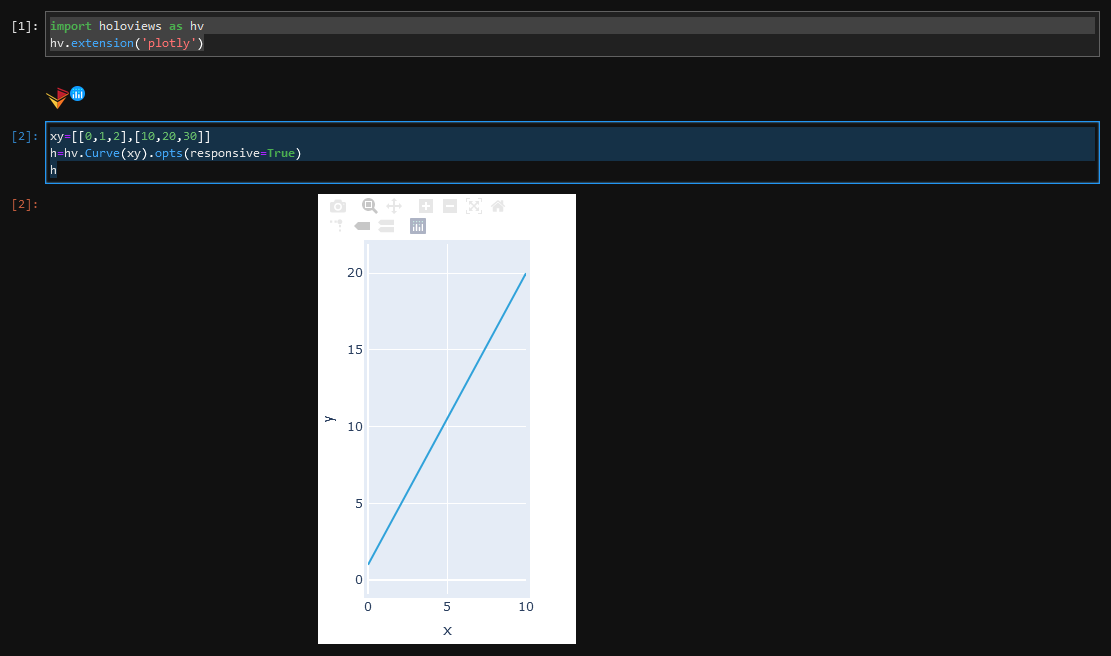
A holoview plot using plotly with responsive=True in a JupyterLab output cell should occupy the full width. Instead, it seems to display itself occupying space from the page center to the rightmost edge, then half a second later resizes itself to be centered, occupying the full height of the output space, but only a fraction of the width.
Complete, minimal, self-contained example code that reproduces the issue
Cell code:
import holoviews as hv
hv.extension('plotly')
xy=[[0,1,2],[10,20,30]]
h=hv.Curve(xy).opts(responsive=True)
h
Stack traceback and/or browser JavaScript console output
No errors reported either by python or javascript.
Screenshots or screencasts of the bug in action
Details
The notebook also shows that if the holoviews plot is rendered to a plotly layout, and the layout is fed to plotly.io.show, a figure that correctly resizes is produced. It also shows that the 'CurvePlot' object that holoviews renderer produces contains a fixed width and height (400 for both, in my case):
r=hv.renderer('plotly')
p=r.get_plot(h)
p
>>CurvePlot(apply_extents=True, apply_ranges=True, aspect='cube', bgcolor=None, clim=(nan, nan), clim_percentile=False, color_levels=None, colorbar=False, colorbar_opts={}, default_span=2.0, finalize_hooks=[], fontscale=None, fontsize=None, height=400, hooks=[], interpolation='linear', invert_axes=False, invert_xaxis=False, invert_yaxis=False, invert_zaxis=False, labelled=['x', 'y', 'z'], logx=False, logy=False, logz=False, margins=(50, 50, 50, 50), name='CurvePlot02654', normalize=True, padding=(0, 0.1), projection=None, responsive=True, show_grid=False, show_legend=False, show_title=True, symmetric=False, title='{label} {group}\n{dimensions}', title_format=None, width=400, xaxis='bottom', xlabel=None, xlim=(nan, nan), xrotation=None, xticks=None, yaxis='left', ylabel=None, ylim=(nan, nan), yrotation=None, yticks=None, zlabel=None, zlim=(nan, nan), zticks=None)
I also notice that on reloading the page ploty's figure still shows, while holoview's is gone. But that's a different issue. Maybe I can wrap my holoviews plot with a Panel pane, and fix this somehow?
import panel as pn; pn.panel(h) improves things considerably, but the responsiveness is partial, and does not respond correctly to toggling the sidebar in jupyter lab, or resizing firefox via maximize/minimize or snapping the window to a corner of the screen; with window size changes the response seems delayed by one change (the current size will match the previous size of the frame).
For all these cases plotly responds correctly.