UpSetR
 UpSetR copied to clipboard
scale.intersections issue
Greatly appreciate UpSetR - thank you for the package!
I am using the CRAN version of UpSetR. I would like to plot data on a log scale, but encountered a problem. scale.sets =log10 plots the original data set bars on a log scale. However, scale.intersections = log10 takes the base 10 logarithm of the data and then plots those values. Is it possible to plot the original intersection data values but on a log scale, as scale.sets does? scale.intersections = log2 results in the same issue. I also encountered a problem (#84) mentioned previously in that using scale.intersections ignores mainbar.y.label https://github.com/hms-dbmi/UpSetR/issues/84.
Thanks! clz UpSet test.pdf
upset(Maples, sets = c("F", "E", "D", "C", "B", "A"), keep.order = TRUE, set.metadata = list(data=metadata2, plots = list(list(type="matrix_rows", column="Plots", colors=c(Shrinking="green", Growing="red")))), sets.x.label = "Number of Trees", order.by = c("degree"), matrix.dot.alpha = 0.9, scale.intersections = "log10", scale.sets = "log10", shade.alpha = 0.5, text.scale = c(1.5, 1.5, 1, 1, 1.5, 1.3))
Hi All, I'm still looking for a solution to the scale.intersections issue above. I would like to have the intersection bars scaled on a log scale, not the base 10 log. Interestingly, this is what scale.sets = "log10" does. I tried looking at the source code, but am way out of my area of expertise.
Hi @mczulu
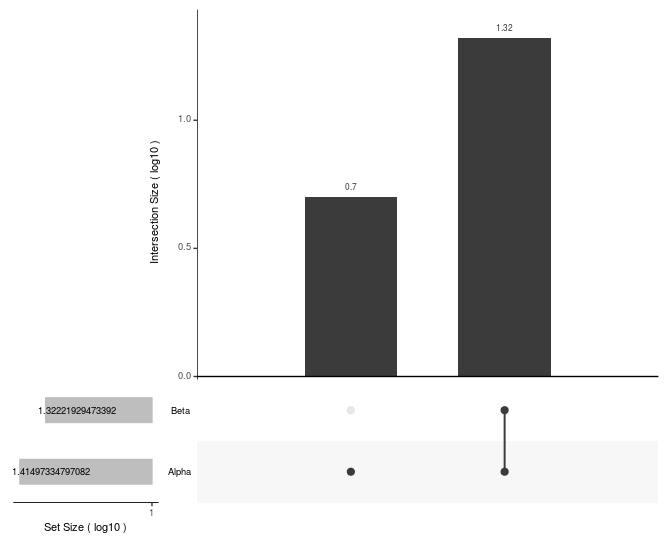
as far as I can tell if you use either the "log10" or the "log2" setting in either the scale.sets or the scale.intersections options you get transformed data. I'm not seeing the scale.sets="log10" plotting the untransformed values on a log10 scale output you describe in the original issue in the example below:
sets <- list()
sets$Alpha <- letters
sets$Beta <- letters[-c(1:5)]

upset(fromList(sets),
	  scale.intersections = "log10",
	  scale.sets = "log10",
	  sets.bar.color = "grey",
	  set_size.show = TRUE)
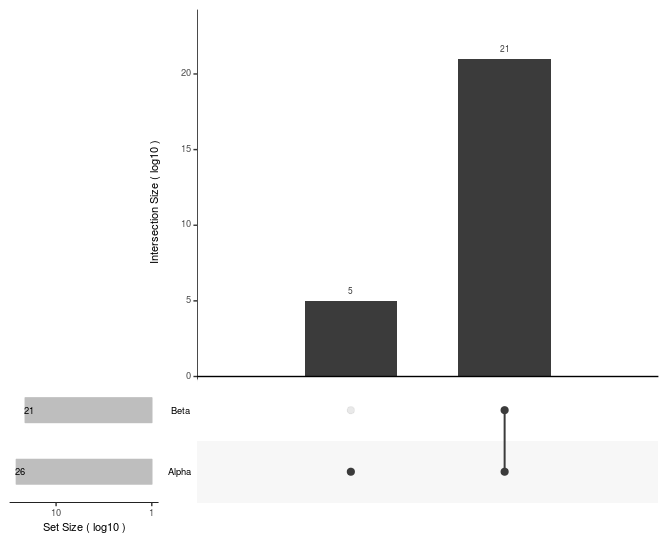
upset(fromList(sets),
	  scale.intersections = "log2",
	  scale.sets = "log2",
	  sets.bar.color = "grey",
	  set_size.show = TRUE)

As an option to not transform the values has not yet been implemented to get untransformed values on both plots in a locally installed version you could commet out the code that transform the data:
lines 110-117 in MainBar.R
if(scale_intersections == "log2"){
  Main_bar_data$freq <- round(log2(Main_bar_data$freq), 2)
  ymax <- log2(ymax)
}
if(scale_intersections == "log10"){
  Main_bar_data$freq <- round(log10(Main_bar_data$freq), 2)
  ymax <- log10(ymax)
}
and lines 57-62 in SizeBar.R
if(scale_sets == "log2"){
  Set_size_data$y <- log2(Set_size_data$y)
}
if(scale_sets == "log10"){
  Set_size_data$y <- log10(Set_size_data$y)
}
Which then yeilds:

Hi Richard-
Thank you for the reply! I have never edited an R package or created my own. Are there any tutorials or sites you could recommend that I might learn how to implement your recommendation? The UpSetR package is installed locally on my machine.
Cheers, Cindy
Hi @mczulu,
I recommend Hadley Wickham's excellent short e-book on R packages: http://r-pkgs.had.co.nz/
In brief, you download a copy of the UpSetR repo, edit the code locally, install the devtools r package, use the install_local("/path/to/local/copy") function from devtools to install your version, load it with library(UpSetR). Then you are using your version.
Thank you!
From: Richard James Acton [email protected] Reply-To: hms-dbmi/UpSetR [email protected] Date: Monday, May 7, 2018 at 3:54 PM To: hms-dbmi/UpSetR [email protected] Cc: Cindy Zuleger [email protected], Mention [email protected] Subject: Re: [hms-dbmi/UpSetR] scale.intersections issue (#99)
Hi @mczuluhttps://github.com/mczulu,
I recommend Hadley Wickham's excellent short e-book on R packages: http://r-pkgs.had.co.nz/
In brief, you download a copy of the UpSetR repo, edit the code locally, install the devtools r package, use the install_local("/path/to/local/copy") function from devtools to install your version, load it with library(UpSetR). Then you are using your version.
— You are receiving this because you were mentioned. Reply to this email directly, view it on GitHubhttps://github.com/hms-dbmi/UpSetR/issues/99#issuecomment-387203310, or mute the threadhttps://github.com/notifications/unsubscribe-auth/Agfvr-7HqFOnQPUdVm_51D-jbKsGYUBNks5twLSOgaJpZM4Qt-DD.
any plans to revisit this issue? seems to be at least a reasonable setting to display the untransformed values (both on the axis and numeric labels) would you accept a PR?