loki
 loki copied to clipboard
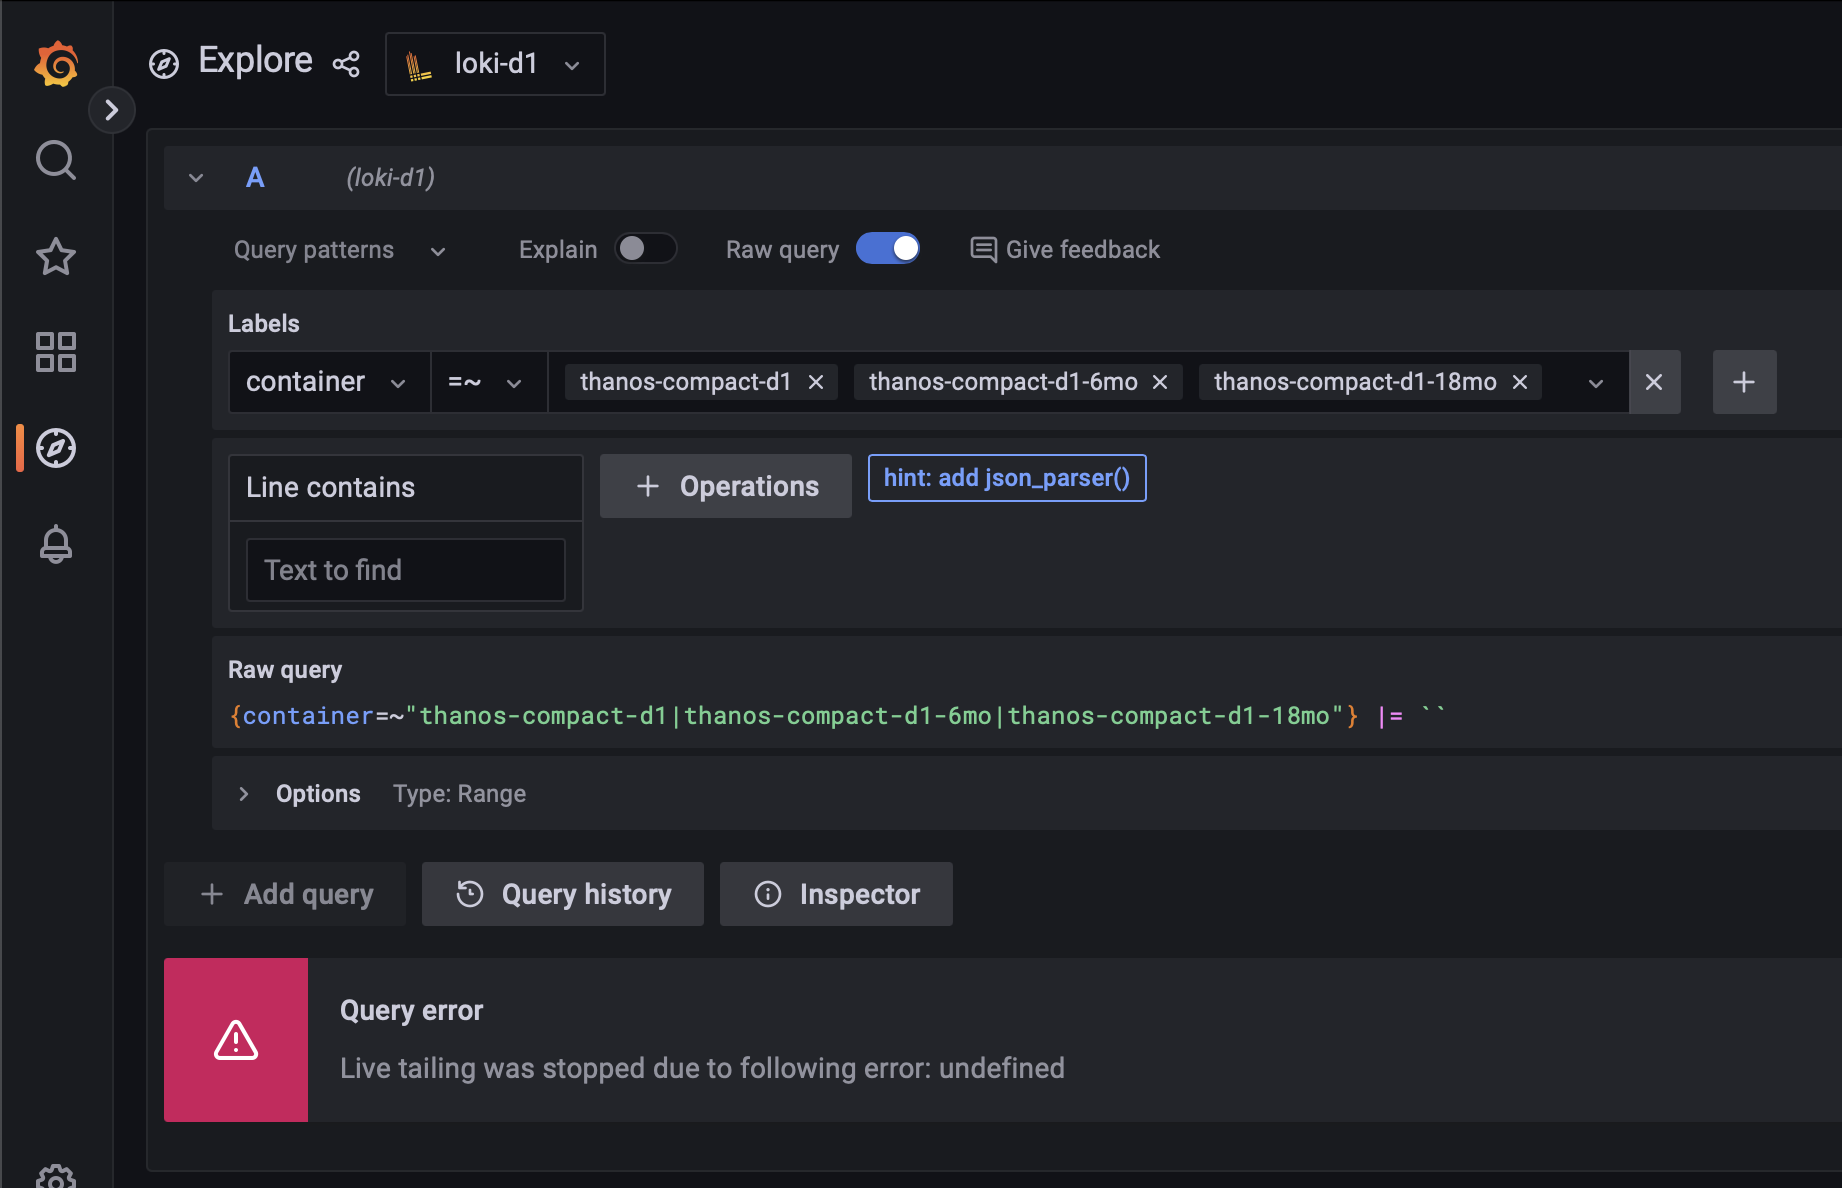
Live tailing was stopped due to following error: undefined
An undefined error is sometimes displayed when attempting to use live tailing of logs via Grafana Explore UI with a datasource that spans multiple tenants. Seemingly the same time, Loki Read logs the following (not completely sure if this is related):
level=warn ts=2022-09-14T10:41:18.304139412Z caller=http.go:273 msg="error getting tenant id" err="multiple org IDs present"
The query in question is for the logs of 3 containers (all of which belong to the same tenant): {container=~"thanos-compact-d1-18mo|thanos-compact-d1|thanos-compact-d1-6mo"} |= ``
Live tailing the above query via a datasource that contains a single tenant always works. Live tailing the above query via a datasource that contains multiple tenants sometimes works and sometimes throws the above error in Grafana.
To Reproduce Steps to reproduce the behavior:
- Started Loki v2.6.1
- Started Grafana v9.1.4
- Add Loki datasource with multiple tenants separated by
|via the X-Scope-OrgID header - Query logs from multiple sources (same tenant) via explore UI.
- Turn on live tailing
Expected behavior All logs matching the query to be live tailed
Environment:
- Infrastructure: Kubernetes
- Deployment tool: Helm
Screenshots, Promtail config, or terminal output
Did you get this resolved? I just started to run into this issue. Didn't seem to have this issue until I configured S3 storage though.
Using loki simple scalable helm chart. my initial suspicion is that this has something to do with local caching not being configured properly. But really not sure yet.
No, we haven't. We were using S3 as the object-storage for our Loki since launch and initially, we were running on pretty much defaults apart from the object-storage settings - that's when we saw the issue appear.
We're also using simple-scalable, or Loki v3.2.1 to be exact.
I'm seeing the same issue with docker.io/grafana/loki:2.5.0 and grafana 9.1.5.
We’re also seeing this issue. Live tailing seems to be broken when using a data source with multiple tenants in the header.
Same problem on my side, i no longer have the error by configuring the following headers at the level of the LOKI datasource:
Connection: Upgrade
Upgrade: websocket
See: #https://github.com/grafana/grafana/issues/22905#issuecomment-628442315
In my case the problem was missing "X-Scope-OrgID" header. Normal logs worked without this header, but not live!
We’re also seeing this issue. Live tailing seems to be broken when using a data source with multiple tenants in the header.
we are having exact same issues when X-Scope-OrgID header contains more than 1 tenant id. Grafana v9.5.3 Loki v2.8.2
We’re also seeing this issue. Live tailing seems to be broken when using a data source with multiple tenants in the header.
we are having exact same issues when X-Scope-OrgID header contains more than 1 tenant id. Grafana v9.5.3 Loki v2.8.2
That's by design :( https://grafana.com/docs/loki/latest/operations/multi-tenancy/#multi-tenant-queries
Only query endpoints support multi-tenant calls. Calls to GET /loki/api/v1/tail and POST /loki/api/v1/push will return an HTTP 400 error if more than one tenant is defined in the HTTP header.
Any solution how to use live log in grafana when datasource with X-Scope-OrgID contains more than 1 tenant id?
Any solution how to use live log in grafana when datasource with X-Scope-OrgID contains more than 1 tenant id?
best workaround i found so far is to use separate datasource per tenant
I've reproduced this in the current version against single updated Loki with a simple query:
I was able to fix this via,
Also have muti tenancy.
https://github.com/grafana/grafana/issues/22905#issuecomment-1644120475
Same error, but another source:
I have Grafana 10.2.1 and Loki 2.9.2 behind nginx proxy with basic auth.
Querying logs from Grafana works normal, but Live tailing throws an error Live tailing was stopped due to following error: undefined and in browser logs I see 401 Unauthorized when connecting to wss.
X-Scope-OrgID header has been set in datasource settings - without it not working at all.
Trying to set Connection and Upgrade headers in datasource without success.
Trying to set Host, Connection, Upgrade and X-Scope-OrgID in nginx config also not helps.
PS: Finally I found the issue in nginx config - my location directive was location ~ /loki/api/.* which was intercepting query to grafana /grafana/api/datasources/proxy/uid/.../loki/api/v1/tail.
Final nginx config:
location = /loki/api/v1/push {
        auth_basic "Restricted area";
        auth_basic_user_file /etc/nginx/.htpasswd;
        proxy_pass $loki_write;
}
location ~ ^/loki/api/(.*) {
        auth_basic "Restricted area";
        auth_basic_user_file /etc/nginx/.htpasswd;
        proxy_pass $loki_read;
}
Live logs are coming, but they are not consistent. After a while, the logs stopping due to the following issue.
Query error
Live tailing was stopped due to following error: undefined
Anyone from Loki could help here?
I was able to fix this via,
Also have muti tenancy.
Can you shine some light one this? We are having the exact issue with multiple tenant ID. But according to this issue here: https://github.com/grafana/grafana/issues/69465
Live tailing for multi-tenancy is not supported