protobuf
 protobuf copied to clipboard
proto: performance regression for cross-version interoperability of generated messages
What version of protobuf and what language are you using? Version: v1.3.5 -> v1.4.2 golang
What did you do? Updated dependency version (see https://github.com/istio/istio/pull/24689/files for exact PR)
What did you expect to see? Performance improves or remains stable
What did you see instead? Performance on marshalling Any types is ~2x slower
Running one of our benchmarks, which is protobuf encoding heavy, we see a huge regression:
$ benchstat /tmp/{old,pr}
name                                 old time/op    new time/op    delta
ListenerGeneration/empty-6             2.82ms ± 0%    5.12ms ± 0%   ~     (p=1.000 n=1+1)
ListenerGeneration/telemetry-6         3.75ms ± 0%    7.50ms ± 0%   ~     (p=1.000 n=1+1)
ListenerGeneration/virtualservice-6    2.81ms ± 0%    5.12ms ± 0%   ~     (p=1.000 n=1+1)

name                                 old alloc/op   new alloc/op   delta
ListenerGeneration/empty-6             1.30MB ± 0%    1.43MB ± 0%   ~     (p=1.000 n=1+1)
ListenerGeneration/telemetry-6         1.62MB ± 0%    1.82MB ± 0%   ~     (p=1.000 n=1+1)
ListenerGeneration/virtualservice-6    1.30MB ± 0%    1.43MB ± 0%   ~     (p=1.000 n=1+1)

name                                 old allocs/op  new allocs/op  delta
ListenerGeneration/empty-6              19.0k ± 0%     25.5k ± 0%   ~     (p=1.000 n=1+1)
ListenerGeneration/telemetry-6          24.4k ± 0%     34.7k ± 0%   ~     (p=1.000 n=1+1)
ListenerGeneration/virtualservice-6     19.0k ± 0%     25.5k ± 0%   ~     (p=1.000 n=1+1)
Looking at profiles, this can be narrowed down to proto.Marshal spending far more time than previously.
Benchmarks can be run from istio/istio with and without the update with go test ./pilot/pkg/proxy/envoy/v2 -run=^$ -bench='.*Generation' -benchmem
CPU profiles: profile-updated.tar.gz profile-old.tar.gz
By the way, these are not really "micro" benchmarks - this is our core functionality, so our entire application will run 2x slower with this update.
Thanks for the report. The attached files do not appear to be .tar.gz files. Please advise.
Sorry I think they should just be .gz. You can view with go tool pprof <FILE> regardless of the filename though
Thanks, was able to generate SVGs for them.
A bulk of the time in the new implementation is spent on "sizePointerSlow":
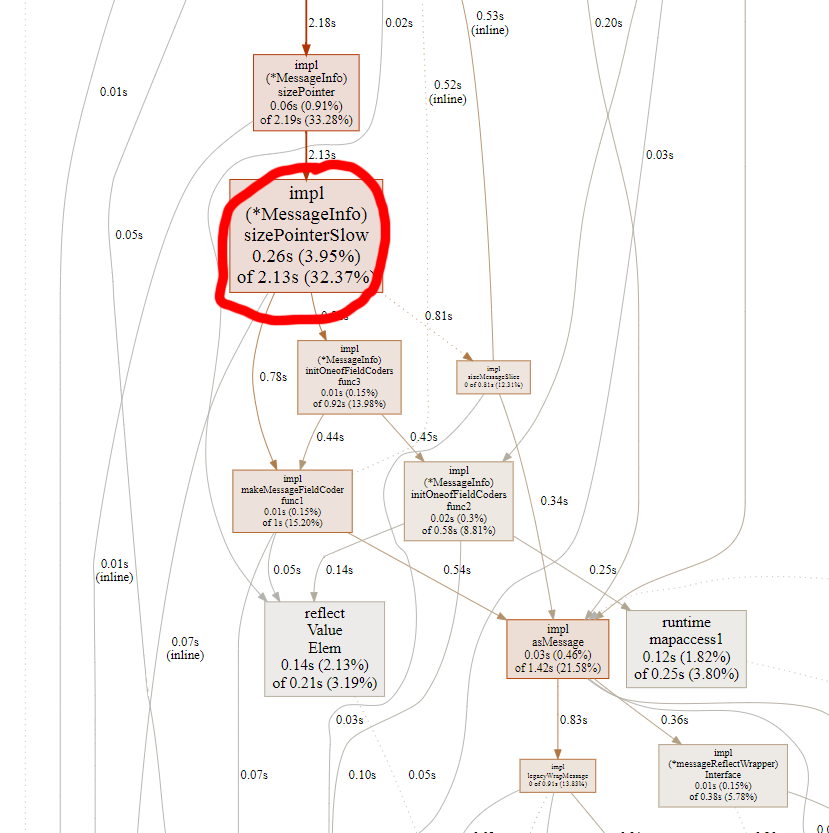
which implies either:
- A bug in the plumbing of the "UseCachedSize" flag, or
- The generated messages have been modified such that they don't have a sizecache field or it is invalid in some way.
To rule out number 2, can you verify whether you use protoc-gen-go to generate your messages, what version of protoc-gen-go was used, and whether any modifications were made to the generated .pb.go files?
Here is the root object: https://github.com/envoyproxy/go-control-plane/blob/master/envoy/config/listener/v3/listener.pb.go (same applies to other types in that repo, just isolating one). At the top we have 'protoc-gen-go', will try to see if there are modifications. They do have a sizecache. The types do use https://github.com/envoyproxy/protoc-gen-validate which may in some way impact this?
Adding @kyessenov in case he has any ideas
At first glance, the generated .pb.go looks fine. This suggests that there's a bug in the plumbing of the "UseSizedCache" flag when traversing between generated messages from older version of protoc-gen-go.
The generated stuff comes straight out of bazel. Maybe bazel toolchain is not configured correctly?
I'm not involved in this repo at all but stumbled upon it, looks like they are seeing similar results - https://github.com/alexshtin/proto-bench/blob/master/README.md
I am not sure if this is the same issue or a different one but interesting the proper v2 API is equal to 1.4 which are both slower than 1.3.
Anyhow not sure how well done that benchmark is but it may be a simpler reproducer than the one I provided?
You mentioned this earlier but just wanted to verify, we upgrades to 1.4 and used newly generated pb.go files and the regression is gone (it's actually a bit faster). So I would agree with the conclusion that it's an issue in older generated code with newer library
@dsnet https://github.com/istio/istio/pull/24956 is the PR, a benchmark is at the top. Some context on the benchmark, it basically is a fairly high level benchmark that covers our primary hot path, which happens to send ~50% of cpu on protobuf stuff. So its both pretty representative of our system and also stressing proto really hard.
When wrapping a legacy message (i.e., one that doesn't natively support the new proto.Message interface), we dynamically create a wrapper for the legacy type. However, the wrapper type doesn't add a Size method, so this could be the cause of quadratic behavior when interacting with old message types.
I can confirm that an application we have at the New York Times exhibited a 2x-3x slowdown when we upgraded to protobuf v1.4.2. We use protobuf to store data in Kafka and our core library is still on v1.3.5. When we use v1.4.2 to marshal, we seem to be impacted by the "wrapping a legacy message" issue. For the time being, I've downgraded this particular application to use v1.3.5.