etcd
 etcd copied to clipboard
How does a slow disk (ssd) influence on etcd performance?
Hi,
I have questions about etcd and disk performance. Even after reading some articles and etcd doc, there are still few questions.
Question 1 The etcd FAQ says:
monitor wal_fsync_duration_seconds (p99 duration should be less than 10ms) to confirm the disk is reasonably fast
In our case 99p of fsync is 13-15ms which is bigger than 10ms.
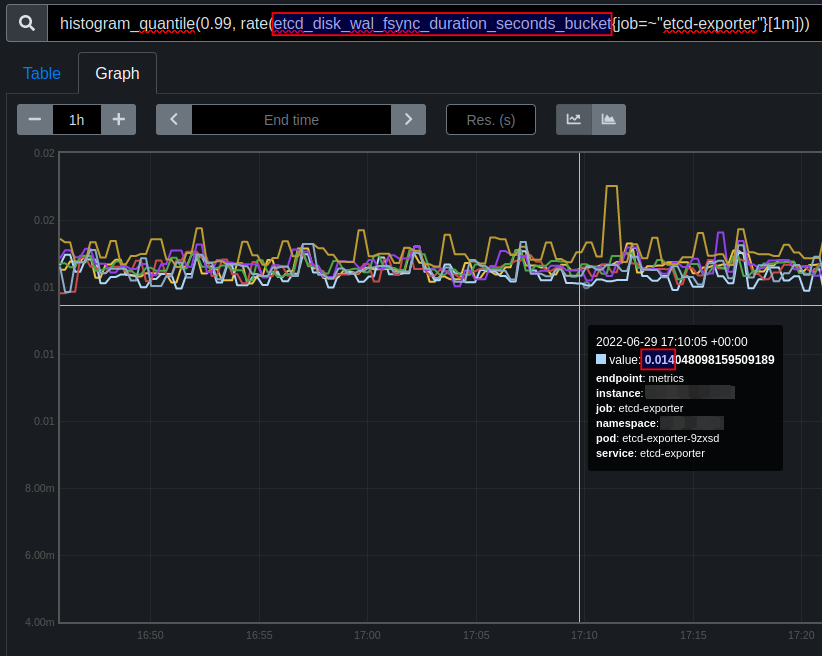
How critical is it? What implication it may have?
We had frequent leader changes. After increasing heart beat intervals and leader election timeout, without deep understanding, leader changes have stopped. But I'm afraid we just hid the issue.
Is it deadly bad or so so? : )
Question 2
The same for etcd_disk_backend_commit_duration_seconds_bucket. It should be less than 25ms but in our case 25-31ms.
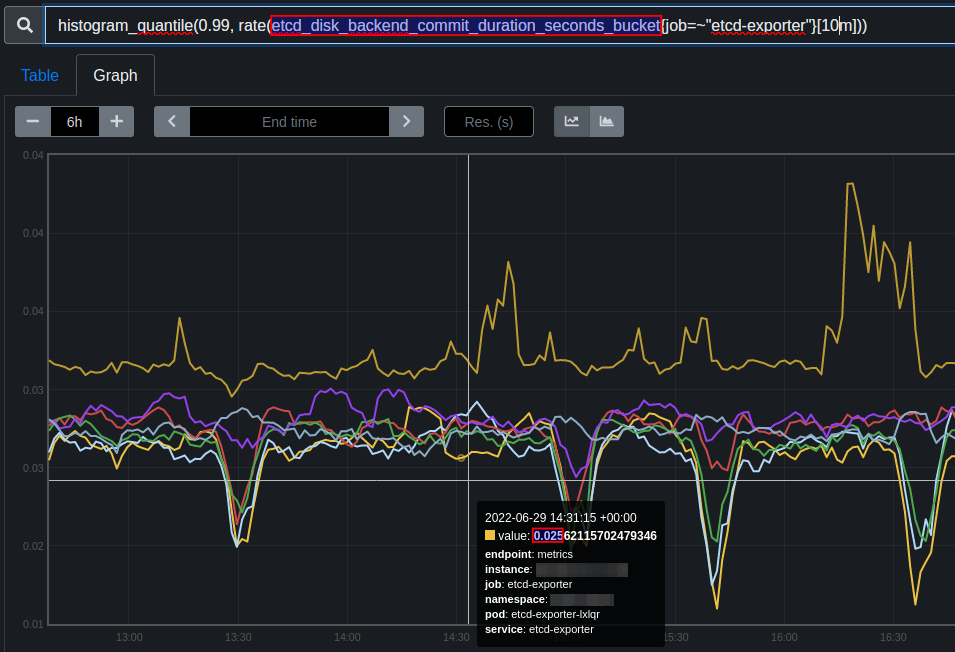
How bad is it? How to understand implication of such slow commit duration?
Maybe based on experience it's easy to say how bad such latency is. Or maybe we need to check something more? E.g. number of requests to etcd. Probably for high load cluster it may mean one and for low load cluster another.
Question 3 I did some test using fio as recommended in ibm's article with new Samsung SSD 980 PRO 1TB.
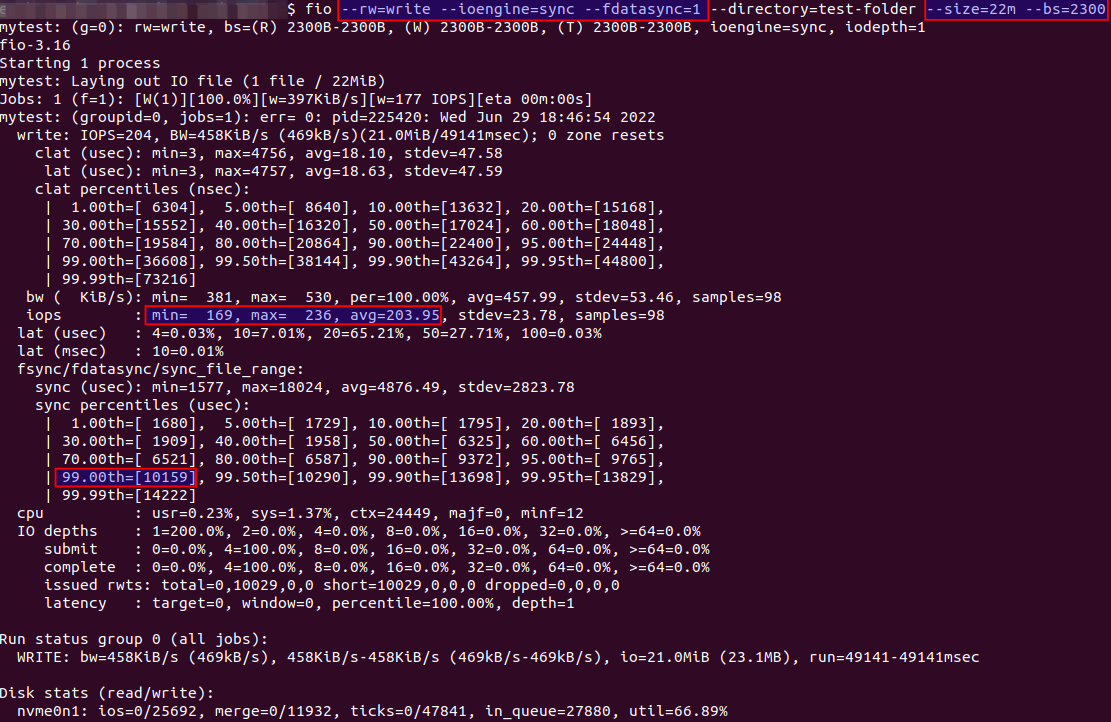
The 99p latency for fsync even on new disk is 5-10ms which already makes them not good for etcd cluster?
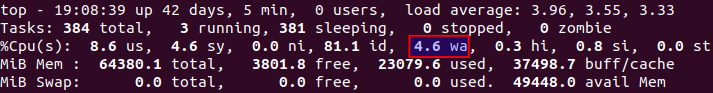
Question 4
By checking top I can see wait time is about 4% in average.
And by checking iostat -d 10 -t and pidstat -d 10 on the same node I can see that etcd has some iodelay.

from man pidstat:
iodelay
                     Block  I/O delay of the task being monitored, measured in clock ticks.
                     This metric includes the delays spent waiting for sync block I/O completion and
                     for swapin block I/O completion.
How critical 4% of wait time and 3 of iodelay for etcd?
Sorry for many screen shoots and not clear questions. Will be happy to hear recommendations for disks for etcd, what to monitor, how to check and maybe stories from experience : )
@moonovo interesting!
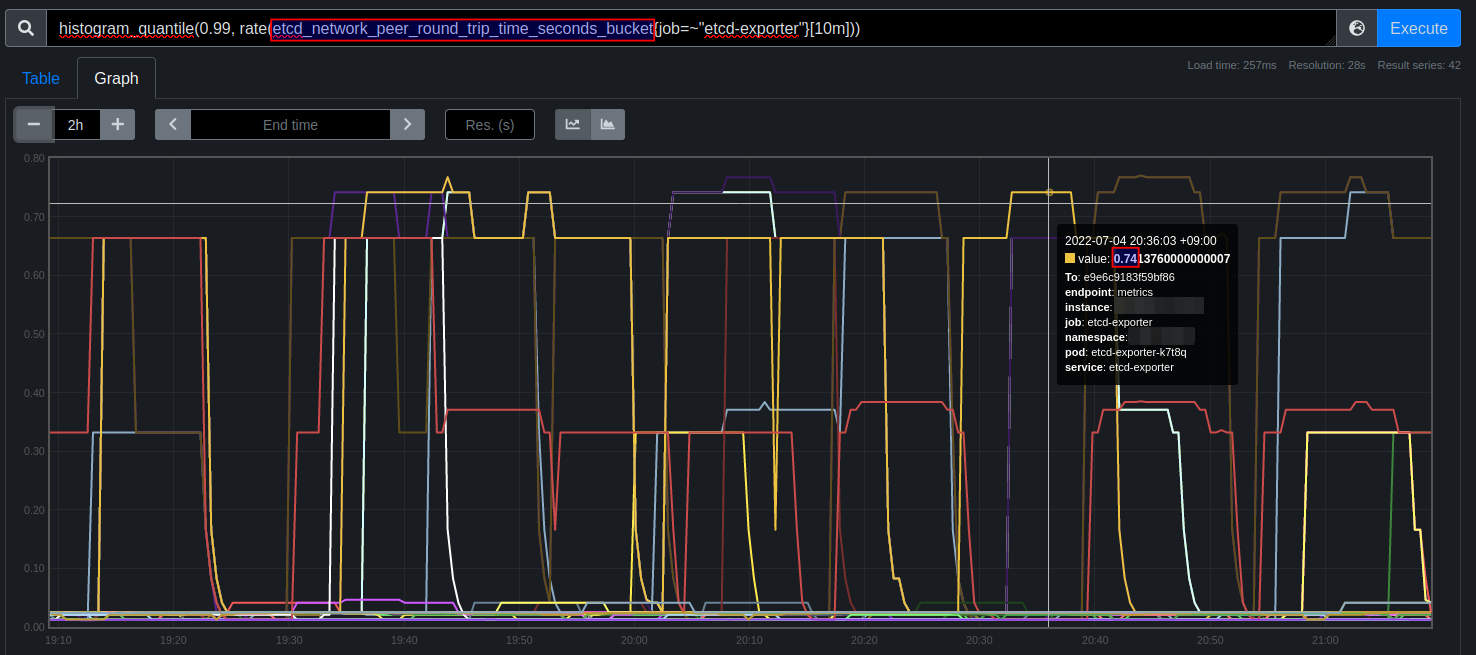
The RTT using ping is 131 us avg, 145 us max, 121 us min (last 10 days, stat from smoke ping).
But the etcd etcd_network_peer_round_trip_time_seconds_bucket 99th percentile is huge - up to 740 ms which 5103 times more comparing to pure network latency!
Is it because etcd collects more samples comparing to my smoke ping (60 samples per minute)? Or is it because etcd's rtt metric includes busy time of member (which might be disk, cpu, whatever) ?
Closing as part of migration of issues labeled as questions to GitHub discussions. GitHub discussions makes it easier for the whole community to provide answered.
If you think your question is still relevant, feel free to ask at https://github.com/etcd-io/etcd/discussions