[15134] Reliable mode: initially very low throughput for tiny messages due to late piggyback
Is there an already existing issue for this?
- [X] I have searched the existing issues
Expected behavior
When sending messages in quick succession in the reliable mode, I would expect a more or less constant throughput.
Current behavior
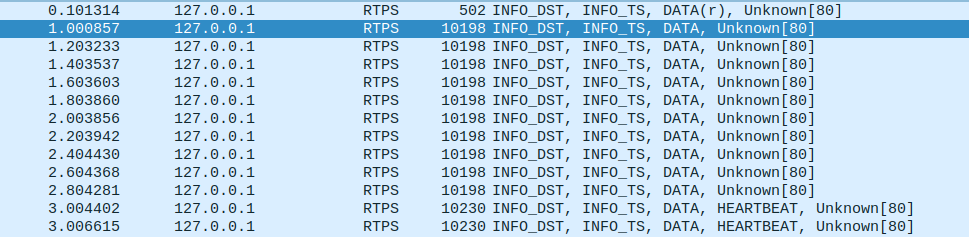
We observe an initially very slow rate of messages (for e.g. message size 100bytes or so). Eventually, the rat will increase. Noticeably, in wireshark we directly see that the slow messages are the ones that are not bundled with a heartbeat. We traced it to the piggyback mechanism kicking in only after a certain data volume has been transmitted.
The code in question is https://github.com/eProsima/Fast-DDS/blob/c6f94c556b42968123301a4daefbabf87dedd9b8/src/cpp/rtps/writer/StatefulWriter.cpp#L1782
In particular, the condition in https://github.com/eProsima/Fast-DDS/blob/c6f94c556b42968123301a4daefbabf87dedd9b8/src/cpp/rtps/writer/StatefulWriter.cpp#L1810
does not trigger for the slow messages. The variable currentUsageSendBufferSize_ is 106496 for us initially, so it will take a lot of messages for the piggyback mechanism to kick in (see also the plot below).
I would like to understand the logic of that function and I would also like to know what we could do to improve the initial data rate. A brute force method would be to send a single message of say 200kB immediately after matching the writer with a reader. Maybe there is a more elegant solution.
Steps to reproduce
A Reader and Writer process on the same domain, topic. The transport has to be in the reliable mode.
The writer sends 10000 messages of 100 bytes each and always waits for acknowledgement.
I can reproduce this either with both processes on the same loopback device or when they run on different machines in the same network.
Fast DDS version/commit
2.6.1
Platform/Architecture
Ubuntu Focal 20.04 amd64
Transport layer
UDPv4
Additional context
Our application uses only the RTPS layer.
XML configuration file
No response
Relevant log output
No response
Network traffic capture
We analyse the behaviour as a function of time. We repeatedly send messages of a fixed size. The message size is 100bytes in the top left, 1000 bytes in the top right, 10Kbytes bottom left and 100Kbytes in the bottom right panel. Time flows from left to right and the y-axis is the throughput where bigger is better. The "flatlining" behaviour is compatible with sending one message per heartbeat.
Hi @iamholger,
We have been running some tests trying to reproduce this issue with no success. Trying different Attribute configurations we managed to arrive at a Wireshark capture similar to the one you attached. However, our messages were shown to be sent at regular intervals in the range of microseconds.
To keep looking into this issue we will need additional information:
- The Attributes you are using for both Publisher and Subscriber would be really helpful, specially those regarding History (both History depth and History kind) and ResourceLimits.
- You mention that you always wait for the acknowledgement. Is this done after each of the 10000 messages or after all of them have been sent?
@iamholger Additionally to what my colleague @jsantiago-eProsima said, you could try setting heartbeatPeriod to a value different from the default (which is 3 seconds). You could achieve that with the following code:
DataWriterQos qos;
// Set periodic heartbeat to 500ms
qos.reliable_writer_qos().times.heartbeatPeriod = {0, 500 * 1000 * 1000};