lovelace-plotly-graph-card
 lovelace-plotly-graph-card copied to clipboard
High CPU usage when card left on-screen
I use a tablet that stays on 24/7, and I have noticed the CPU temperature of my netbook home assistant host PC show severe spikes as long as the lovelace-plotly-graph-card is kept visible on screen. If i go to another lovelace page, without this custom card, the CPU temperature spikes are immediately gone.

Interesting, you may want to increase the refresh_interval to 60 seconds for example https://github.com/dbuezas/lovelace-plotly-graph-card#refresh_interval
The card should only make the server work when it refreshes, and even then, it only fetches states between the most recen update and "now".
Is is a complex plot? If you post the yaml here I can take a look
Great advice! I will try it out right away. The yaml setup is as vanilla as it gets, but as the sensor data being plotted is updated every 3 seconds or so, this may very well be a part of the issue (though plot refresh interval was set to 10sec until now).
However, as one can tell by the trend of the temp spikes above, there issue seems to get worse over time, the longer the plot is left open. To me, this seems to indicate that the constant flow of data is accumulating rather than replacing the preexisting plot data. Is this by design, or can I configure this behaviour somehow? What are your thoughts?
Card config used:
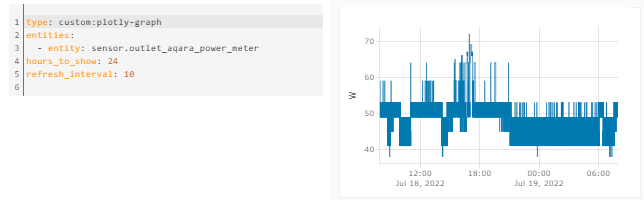 `
`
The card is designed to throw away the data that falls out of the screen as long as you are not "browsing" (zoom, scroll, etc), so no.
There shouldn't be data accumulation. Do you still observe this this behaviour? does it also happen if you set refresh_interval: 0 ?
No, you were quite right. These load spikes seem to have been triggered by activity unrelated to the plotly-graph-cards. I'm still not sure about the real cause, but whatever it was, it seems to have disappeared altogether. Sorry to have taken your time with this!
Keep up the great work :)