cockpit
 cockpit copied to clipboard
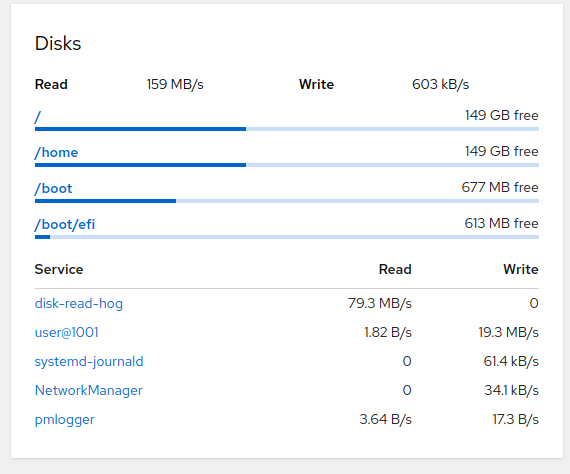
Metrics: Add per-process disk IO usage
Hmm, this is tricky. cgroupv2 certainly has an "io" controller which can do this per-service, but it's not enabled by default at least in Fedora. The approach here is very expensive, thus things like cgroup default config or PCP really shouldn't collect this all the time. On our metrics page we can afford to do more expensive operations, as that isn't running all the time.
But you are right that this makes things inconsistent -- showing services (cgroups) in two cards, and processes here. Showing the process names is not actionable -- we can't link them anywhere (like the services page), and the current version does not even show a pid number so that the admin can kill or investigate.
However, it is reasonably simple to map a pid to its containing cgroup by reading /proc/pid/cgroup. This may also reduce the amount of data a bit -- currently it sends this very large array of processes. I suppose compression takes place (null values for processes which are quiet and thus don't have any I/O), but it's still quite taxing on the bridge/websocket I/O?
current version does not even show a pid number so that the admin can kill or investigate
pid is there in the code but it's not visible in the UI yet
However, it is reasonably simple to map a pid to its containing cgroup by reading /proc/pid/cgroup. This may also reduce the amount of data a bit
So what you're saying is: read IO of processes and sum it for its cgroup, then send it?
So what you're saying is: read IO of processes and sum it for its cgroup, then send it?
Yes, I think that would make sense. Note that all of this would be significantly easier in the Python bridge. However, that is probably still 6 months out..
all of this would be significantly easier in the Python bridge. However, that is probably still 6 months out..
Oh it sure would! And I hope it's sooner than that 😃
Is there a better way to collect these statistics from the cgroup machinery itself?
There is a cgroup io controller but as far as I understand it is disabled by default.
While cgroupv2 offers a controller for monitoring disk usage, it is usually disabled and needs to be manually delegated in order to monitor every subtree of the cgroup hierarchy. I tested this approach in #18070 and it turns out most of our testing VMs have it completely disabled and some such as debian-testing have it partially enabled for system services.
So instead of directly relying on cgroups I suggest we iterate over all processes in the /proc/[pid] folders and map them to their cgroup. It is an expensive task to perform but since it is only going to run when the metrics page is visible I believe we can afford to do this.
As alternative we can read /sys/fs/cgroup/system.slice/libvirtd.service/cgroup.procs and then only read the /proc/$pid/io files. Still feels a bit meh
It is an expensive task to perform but since it is only going to run when the metrics page is visible I believe we can afford to do this.
How "expensive" is it? Can you put it in terms of IO, CPU load, etc.? Does it cause any spikes? Is it noticeable by the user? Or is it just "more expensive than just asking cgroups for the data"?
not enabled by default at least in Fedora
Can we petition for them to enable it in future versions? Is there anywhere we know of (like our supported distros) that have it enabled? Does it make sense to try to use cgroups when possible and then use the "expensive" fallback otherwise? (If it's not enabled anywhere, then it feels like that extra work to do it the right way is pointless for now... just future proofing otherwise.)
It's mainly this:
Or is it just "more expensive than just asking cgroups for the data"?
and it doesn't cause any spikes even after I spawned multiple hundreds of processes that it needs to sample.
and it doesn't cause any spikes even after I spawned multiple hundreds of processes that it needs to sample.
Ah cool.
I was doing to suggest only updating half as often as other updates (or something like this) otherwise. So the information is still there, still updated, and still useful... just not refreshed as much.
I'm glad "expensive" is only relatively expensive.
I still have huge reservations about the massive amount of work that this is going to involve. I wonder if we rather do this with the cgroups approach, but only if that controller is enabled?
With the controller often being disabled or not fully enabled in the whole cgroup structure I think it's more accurate to collect this from /proc.
Otherwise, a very large amount of the code here is essentially replicating
read_keyed_int64()which already exists incockpitcgroupsamples.c. I wonder if we could find a way to share that code rather than adding a new copy of the same thing.
You have a point, actually. The way @jelly suggested and how this could fit into the cockpitcgroupsamples.c is reading PIDs from cgroup.procs, then getting relevant io statistics from /proc/PID/io and sample it. It's still a lot of processes to check but on the upside it avoids the complexity of using hash table and I could reuse the existing code.
As mentioned in IRC: this entire approach might not be very robust against processes changing cgroups. In that case, the amount of cumulative IO in the old cgroup is going to have a sudden negative change, and in the new group, a sudden positive change...
You have successfully added a new shellcheck configuration differential-shellcheck. As part of the setup process, we have scanned this repository and found no existing alerts. In the future, you will see all code scanning alerts on the repository Security tab.
You have successfully added a new CodeQL configuration /language:python. As part of the setup process, we have scanned this repository and found 16 existing alerts. Please check the repository Security tab to see all alerts.
Metrics page pixel testing became very unstable with this PR https://cockpit-logs.us-east-1.linodeobjects.com/pull-17692-20230504-101125-f305d649-fedora-37/log.html
@martinpitt are you fine with the removal of the pixel tests? I can try to re-add them - but i don't want to block this anymore.