Clementine
 Clementine copied to clipboard
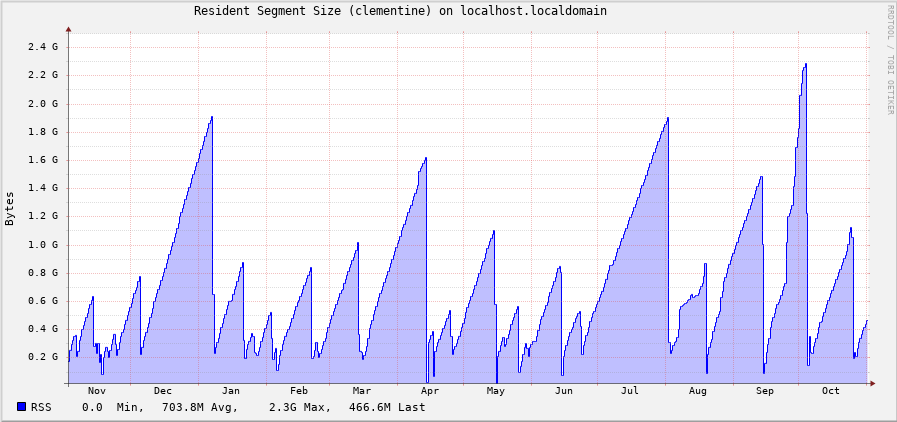
~50MB daily memory leak
Before posting
Please follow the steps below and check the boxes with [x] once you did the step.
- [x] I checked the issue tracker for similar issues
- [x] I checked the changelog if the issue is already resolved
- [ ] I tried the latest Clementine build from here
System information
Please provide information about your system and the version of Clementine used.
- Operating System: Arch linux, KDE
- Clementine version: 1.4 rc2
Expected behaviour / actual behaviour
Clementine memory usage stays roughly the same during usage.
Yet for me it leaks about 50MB a day. And it have been doing this for quite a long time and several consequent versions:
Steps to reproduce the problem (only for bugs)
Well for me this is just start clementine and wait. It leaks RAM regardless of what I do, even just simply lying minimized to tray icon without playback.
I don't have skills/time to fix this by myself, but I'd be happy to provide more info. And I need some brief hints on how to collect required data.
I've tried running clementine overnight via Valgrind. It seems to recognize the leaks:
4,194,288 bytes in 1 blocks are possibly lost in loss record 5,954 of 5,955
   at 0x483A77F: malloc (vg_replace_malloc.c:307)
   by 0x4E58912: QArrayData::allocate(unsigned long, unsigned long, unsigned long, QFlags<QArrayData::AllocationOption>) (in /usr/lib/libQt5Core.so.5.15.1)
   by 0x503A1AA: ??? (in /usr/lib/libQt5Core.so.5.15.1)
   by 0x503A353: ??? (in /usr/lib/libQt5Core.so.5.15.1)
   by 0x5035D9A: QCoreApplication::postEvent(QObject*, QEvent*, int) (in /usr/lib/libQt5Core.so.5.15.1)
   by 0x505F3EF: ??? (in /usr/lib/libQt5Core.so.5.15.1)
   by 0x5069FD4: ??? (in /usr/lib/libQt5Core.so.5.15.1)
   by 0x4CB2E44: QNetworkConfigurationManagerPrivate::updateConfigurations() (in /usr/lib/libQt5Network.so.5.15.1)
   by 0x505F7E1: QObject::event(QEvent*) (in /usr/lib/libQt5Core.so.5.15.1)
   by 0x5032CAF: QCoreApplication::notifyInternal2(QObject*, QEvent*) (in /usr/lib/libQt5Core.so.5.15.1)
   by 0x50357D2: QCoreApplicationPrivate::sendPostedEvents(QObject*, int, QThreadData*) (in /usr/lib/libQt5Core.so.5.15.1)
   by 0x508C303: ??? (in /usr/lib/libQt5Core.so.5.15.1)

13,378,064 bytes in 119,447 blocks are possibly lost in loss record 5,955 of 5,955
   at 0x483ADEF: operator new(unsigned long) (vg_replace_malloc.c:342)
   by 0x505F13C: ??? (in /usr/lib/libQt5Core.so.5.15.1)
   by 0x5069FD4: ??? (in /usr/lib/libQt5Core.so.5.15.1)
   by 0x4CB2E44: QNetworkConfigurationManagerPrivate::updateConfigurations() (in /usr/lib/libQt5Network.so.5.15.1)
   by 0x505F7E1: QObject::event(QEvent*) (in /usr/lib/libQt5Core.so.5.15.1)
   by 0x5032CAF: QCoreApplication::notifyInternal2(QObject*, QEvent*) (in /usr/lib/libQt5Core.so.5.15.1)
   by 0x50357D2: QCoreApplicationPrivate::sendPostedEvents(QObject*, int, QThreadData*) (in /usr/lib/libQt5Core.so.5.15.1)
   by 0x508C303: ??? (in /usr/lib/libQt5Core.so.5.15.1)
   by 0x593E913: g_main_context_dispatch (in /usr/lib/libglib-2.0.so.0.6600.2)
   by 0x59927D0: ??? (in /usr/lib/libglib-2.0.so.0.6600.2)
   by 0x593D120: g_main_context_iteration (in /usr/lib/libglib-2.0.so.0.6600.2)
   by 0x508B940: QEventDispatcherGlib::processEvents(QFlags<QEventLoop::ProcessEventsFlag>) (in /usr/lib/libQt5Core.so.5.15.1)
Well, this is a progress, but quite unspecific. How can I pinpoint the leak?
I'm not sure what 1.4 rc2 is, but there have been a few memory leaks fixed in recent months. In the graph in your initial report, is each drop a Clementine restart?
As far as instrumentation goes, valgrind is great. You can use the the massif tool to track the outstanding allocations and the massif-visualizer is helpful for analyzing the results. You may also want to install additional debug symbols to get more complete stack trace information.
In the graph in your initial report, is each drop a Clementine restart?
Yep, each drop is a Clementine restart. I'll come back when have some data from running Clementine with debug symbols via valgrind.
More than a year have passed, now I am at https://github.com/clementine-player/Clementine/releases/tag/1.4.0rc1-776-gcefe81d0c and still this memory leak bugs me.
I've recorded heaptrack trace of memory allocations of Clemetine running for 3 days: http://45.86.162.4/files/2022/heaptrack.clementine.1966167_19.zst I can collect more data if anyone points me what data is required to investigate and fix this.