altair
 altair copied to clipboard
How easy is it to get crosshatch patterns on altair bar charts?
Hi all,
I'm quite impressed with the ease of use of Altair, but in considering using it and teaching it to my colleagues, one thing I haven't found an API function for is crosshatching on charts for black & white readability, similar to matplotlib's 'hatch' functionality. Unfortunately this is critical to have for the type of work I'm trying to use it for.

This forum post here suggests this is possible by going up a level to vega-lite functionality: https://news.ycombinator.com/item?id=19844153. Does any of you know how easy/possible that actually is?
It's not currently supported; Vega feature request is here: https://github.com/vega/vega/issues/1372
Note that it is possible to do in Vega-Lite (and thus in Altair) by injecting extra svg definitions into the HTML output and referencing them in the fill scale: https://observablehq.com/@oliviafvane/how-to-use-textures-patterns-in-vega-lite
I'm not aware of any examples translating this approach to Altair.
I was looking for similar. Tried a quick translation of the example linked above into Jupyter Notebook + Altair. Something like?:
## altair renderer experiment

## based on:
# https://observablehq.com/@oliviafvane/how-to-use-textures-patterns-in-vega-lite
# https://github.com/altair-viz/altair/issues/2103

from IPython.display import HTML

HTML('''
<svg height="0" width="0" xmlns="http://www.w3.org/2000/svg" version="1.1">
<defs>

<!-- From SVG stripe generator
https://www.coffee-break-designs.com/labs/svg_stripe_generator/ -->

<pattern id="pattern_1" patternUnits="userSpaceOnUse" width="3" height="3" patternTransform="rotate(45)">
<line x1="0" y="0" x2="0" y2="3" stroke="#000000" stroke-width="4" />
</pattern>

<!-- From Pattern Fills by Irene Ros
http://iros.github.io/patternfills/sample_svg.html
http://iros.github.io/patternfills/ -->

<pattern id="pattern_2" patternUnits="userSpaceOnUse" width="8" height="8"> <image xlink:href="data:image/svg+xml;base64,PHN2ZyB4bWxucz0naHR0cDovL3d3dy53My5vcmcvMjAwMC9zdmcnIHdpZHRoPSc4JyBoZWlnaHQ9JzgnPgogIDxyZWN0IHdpZHRoPSc4JyBoZWlnaHQ9JzgnIGZpbGw9JyNmZmYnLz4KICA8cGF0aCBkPSdNMCAwTDggOFpNOCAwTDAgOFonIHN0cm9rZS13aWR0aD0nMC41JyBzdHJva2U9JyNhYWEnLz4KPC9zdmc+Cg==" x="0" y="0" width="8" height="8"> </image> </pattern>

<pattern id="pattern_3" patternUnits="userSpaceOnUse" width="10" height="10"> <image xlink:href="data:image/svg+xml;base64,PHN2ZyB4bWxucz0naHR0cDovL3d3dy53My5vcmcvMjAwMC9zdmcnIHdpZHRoPScxMCcgaGVpZ2h0PScxMCc+CiAgPHJlY3Qgd2lkdGg9JzEwJyBoZWlnaHQ9JzEwJyBmaWxsPScjNTU5NGU3Jy8+CiAgPHBhdGggZD0nTS0xLDEgbDIsLTIKICAgICAgICAgICBNMCwxMCBsMTAsLTEwCiAgICAgICAgICAgTTksMTEgbDIsLTInIHN0cm9rZT0nd2hpdGUnIHN0cm9rZS13aWR0aD0nMScvPgo8L3N2Zz4=" x="0" y="0" width="10" height="10"> </image> </pattern>

<pattern id="houndstooth" patternUnits="userSpaceOnUse" width="10" height="10"> <image xlink:href="data:image/svg+xml;base64,PHN2ZyB3aWR0aD0nMTAnIGhlaWdodD0nMTAnIHhtbG5zPSdodHRwOi8vd3d3LnczLm9yZy8yMDAwL3N2Zyc+CiAgPHBhdGggZD0nTTAgMEw0IDQnIHN0cm9rZT0nI2FhYScgZmlsbD0nI2FhYScgc3Ryb2tlLXdpZHRoPScxJy8+CiAgPHBhdGggZD0nTTIuNSAwTDUgMi41TDUgNUw5IDlMNSA1TDEwIDVMMTAgMCcgc3Ryb2tlPScjYWFhJyBmaWxsPScjYWFhJyBzdHJva2Utd2lkdGg9JzEnLz4KICA8cGF0aCBkPSdNNSAxMEw1IDcuNUw3LjUgMTAnIHN0cm9rZT0nI2FhYScgZmlsbD0nI2FhYScgc3Ryb2tlLXdpZHRoPScxJy8+Cjwvc3ZnPgo=" x="0" y="0" width="10" height="10"> </image> </pattern>

</defs>
</svg>
''')
# note, this needs to be in a separate Jupyter Notebook cell from the HTML section above
import pandas as pd
import altair as alt
alt.renderers.enable('svg') # vs normal 'default'
print('Altair renderer: ', alt.renderers.active)
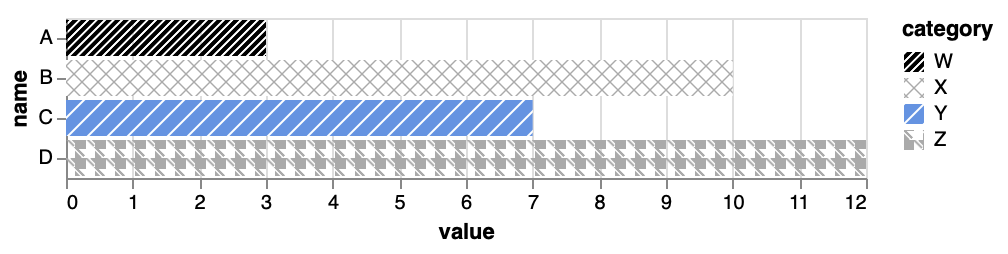
data = [{'name':'A', 'value': 3, 'category': 'W' },
{'name':'B', 'value': 10, 'category': 'X'},
{'name':'C', 'value': 7, 'category': 'Y'},
{'name':'D', 'value': 12, 'category': 'Z'}]
df = pd.DataFrame(data)
# display(df)
pattern_scale = ({
'domain': ['W', 'X', 'Y', 'Z'],
'range': ['url(#pattern_1)', 'url(#pattern_2)', 'url(#pattern_3)', 'url(#houndstooth)']
});
# display(pattern_scale)
chart = alt.Chart(df).mark_bar().encode(
y="name:N",
x="value:Q",
fill=alt.Fill("category:N", scale=pattern_scale)
)
chart.display()
Quick screen-shot of the output:
I haven't yet stopped to understand how the pattern spec works, or how to define different patterns.
Now how do I get it to save as image file (for my automatic slide generation flow)??
chart.save('chart.svg') # just gave a chart with axes but no content visible
Looking closer, the pattern spec is actually very straightforward to understand. See update with what I interpret to be an equivalent data-set to the original question:
## altair renderer experiment

## based on:
# https://observablehq.com/@oliviafvane/how-to-use-textures-patterns-in-vega-lite
# https://github.com/altair-viz/altair/issues/2103

from IPython.display import HTML

HTML('''
<svg height="0" width="0" xmlns="http://www.w3.org/2000/svg" version="1.1">
    <defs>

        <!-- From SVG stripe generator
        https://www.coffee-break-designs.com/labs/svg_stripe_generator/ -->

        <pattern id="diagonal_up_left" patternUnits="userSpaceOnUse" width="9.5" height="9.5" patternTransform="rotate(-45)">
            <line x1="0" y="0" x2="0" y2="9.5" stroke="#000000" stroke-width="4" />
        </pattern>

        <pattern id="diagonal_up_right" patternUnits="userSpaceOnUse" width="9.5" height="9.5" patternTransform="rotate(45)">
            <line x1="0" y="0" x2="0" y2="9.5" stroke="#000000" stroke-width="4" />
        </pattern>

        <pattern id="cross_hatch" patternUnits="userSpaceOnUse" width="9.5" height="9.5" patternTransform="rotate(45)">
            <line x1="0" y="0" x2="9.5" y2="0" stroke="#000000" stroke-width="4" />
            <line x1="0" y="0" x2="0" y2="9.5" stroke="#000000" stroke-width="4" />
        </pattern>

    </defs>
</svg>
''')
# note, this needs to be in a separate Jupyter Notebook cell from the HTML section above

import pandas as pd
import altair as alt

alt.renderers.enable('svg') # vs normal 'default'
# print('Altair renderer: ', alt.renderers.active)

# downloaded and saved local copy of cars data file from:
# https://www.kaggle.com/ljanjughazyan/cars1

filename = 'datasets-6673-9658-CARS.csv'
df = pd.read_csv(filename)
df = df.groupby(['Type', 'Origin']).agg({'MPG_City':'mean', 'MPG_Highway':'mean'})
df = df.reset_index()
df = df[df['Type']!='Hybrid']
# display(df.head())

pattern_scale = ({
   'domain': ['Asia', 'Europe', 'USA'],
   'range': ['url(#diagonal_up_left)', 'url(#cross_hatch)', 'url(#diagonal_up_right)']
});

chart = alt.Chart(df).mark_bar(stroke='black').encode(
    x=alt.X('Origin:N', title=None, axis=alt.Axis(labels=False)),
    y=alt.Y('MPG_City:Q', title=None, axis=alt.Axis(tickMinStep=5, tickCount=5, labelFontSize=16)),
    column=alt.Column('Type:N', header=alt.Header(title=None, labelOrient='bottom', labelFontSize=16)),
    fill=alt.Fill("Origin:N", scale=pattern_scale)
).properties(
    title='Mileage by Type and Origin',
    width=150
).configure_title(
    fontSize=20,
    anchor='middle'
).configure_legend(
    orient='bottom',
    labelFontSize=16,
    strokeColor='black',
    padding=10, rowPadding=5, titlePadding=10,
    titleFontSize=16, titleOrient='left',
)


chart.display()
Quick screen-shot of the output:
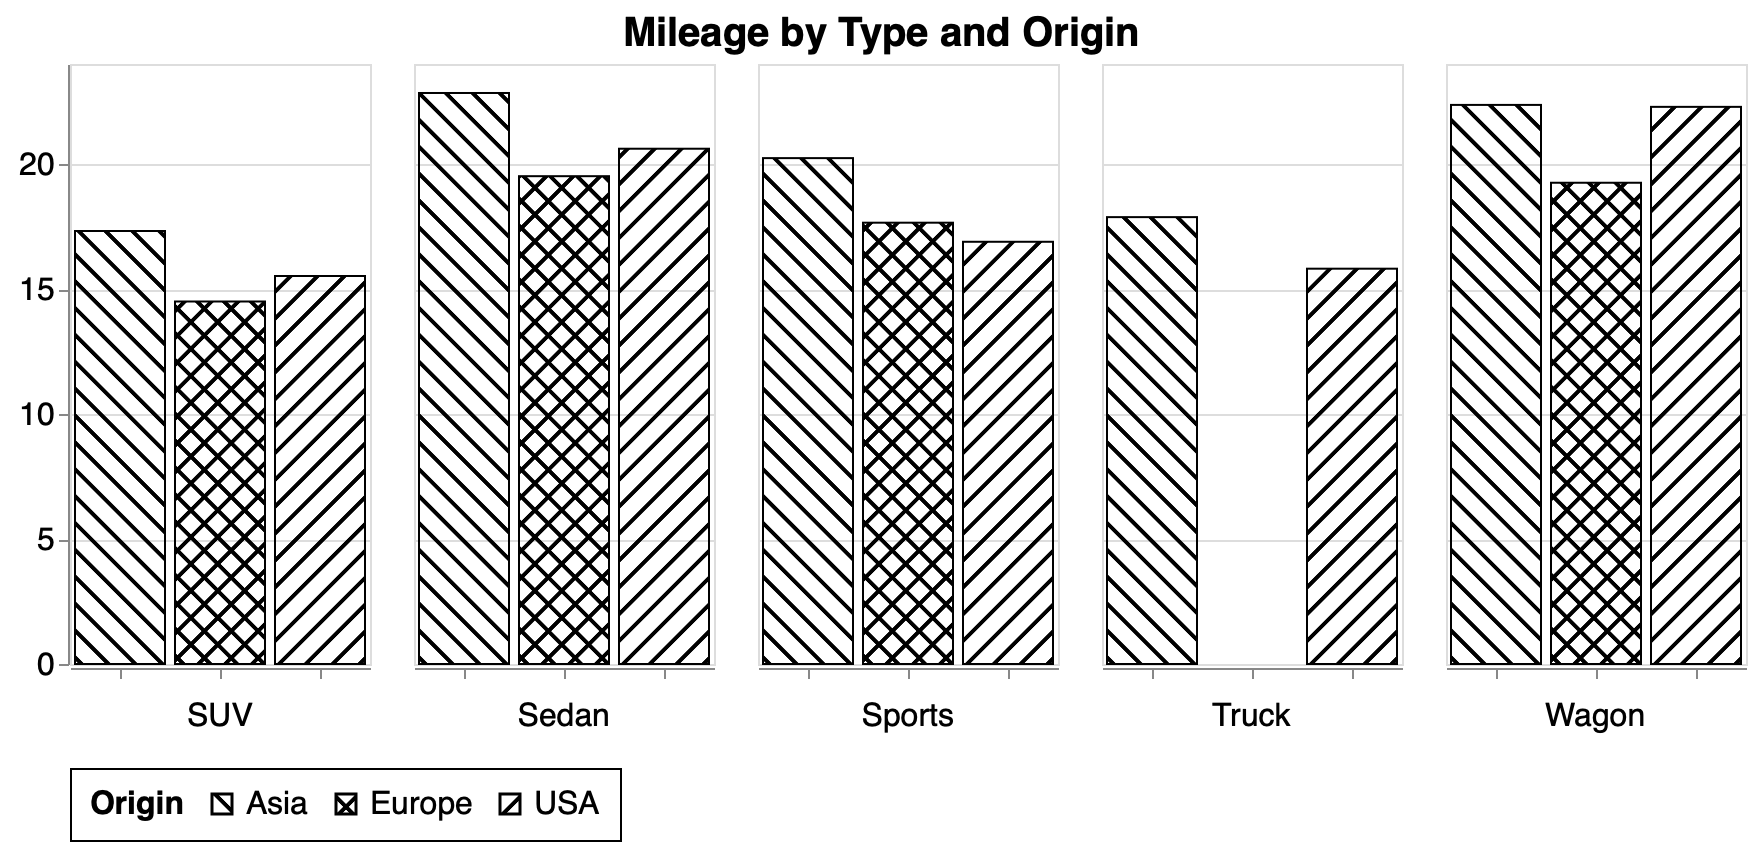
I tried but failed to place the legend bottom centre. Any hints?
I would also still like a way to save to an image file (preferably jpg or png), to use with automatic slide generation flow. Any suggestions? (on Mac, using Selenium and chrome driver for Altair saver back-end)
chart.save('chart.svg') # saved an image of most of the chart, but only empty boxes for the bars, no SVG lines
chart.save('chart.png') # saved an image of most of the chart, but only empty boxes for the bars, no SVG lines
I am interested in using a capability like this, but I am not able to get the example above to work. If I use the 'svg' in the renderer command, I get an error as follows: ValueError: No enabled saver found that supports format='svg'. I use 'default', then I get black bordered bars with no fill patterns. I'd like to be able to match this output before trying to use it in my project. When I run the separate notebook cell with the HTML, the "output" cell is just a blank cell. Is that expected? Thanks in advance for any help.
Hi @feldmangregory , I (on Mac) tend to see that sort of "no enabled saver found ..." type of message when the version of chromedriver is not up to date. For example, these were my notes when Altair saver stopped saving last month (on png in that case, but I suspect similar behaviour likely for svg). Looking online just now, I see that there is already a slightly newer version of chromedriver than I used below. Latest stable release: ChromeDriver 91.0.4472.101
# 5-Jun-2021:
# Refresh on Mac for Altair saver problem (No enabled saver found that supports format='png')
# Assuming due to update of Chrome, which requires update of chromedriver
# https://chromedriver.chromium.org
# Latest stable release: ChromeDriver 91.0.4472.19
conda activate py3
wget https://chromedriver.storage.googleapis.com/91.0.4472.19/chromedriver_mac64.zip
unzip chromedriver_mac64.zip
rm chromedriver_mac64.zip
mv chromedriver /usr/local/bin/
jupyter notebook
Thanks for the idea. I tried installing the latest stable chromedriver and added it to my path for Windows 10, but no luck. Same issue.
Hi @feldmangregory , shame, ok I guess I was too-quickly jumping to specifics of what worked for my setup. I suggest you take a look and check the altair_saver setup & dependencies information: https://github.com/altair-viz/altair_saver