enrichplot
 enrichplot copied to clipboard
Published
20 hours ago •
 YuLab-SMU
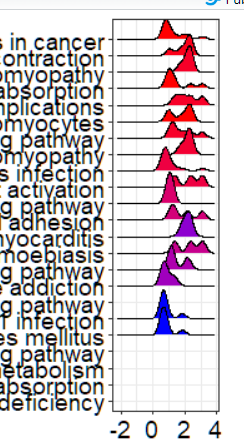
ridgeplot shows some pathway with no ridges
 Dear Yu ,
When using ridgeplot to draw a picture, it seems that there are always several items that cannot be drawn for gseresult. This is very strange. After I edit the source code, I still can't draw it.
Dear Yu ,
When using ridgeplot to draw a picture, it seems that there are always several items that cannot be drawn for gseresult. This is very strange. After I edit the source code, I still can't draw it.
d1 =data.frame(gs2val.df[sapply(gs2val, length)>2,],stringsAsFactors = F)
d1$category = as.character(d1$category)
ggplot(  d1  , aes_string(x="value", y="category", fill=fill))+
  ggridges::geom_density_ridges( ) +
   scale_fill_continuous(low="red", high="blue", name = fill,guide=guide_colorbar(reverse=TRUE)) +
  xlab(NULL) + ylab(NULL) +  theme_dose()
Thanks a lot!
I had the same issue with ridgeplot() and setting core_enrichment = FALSE resolved the issue. Noticeably, all terms with missing ridges had only two of core enriched genes. Unfortunately I can not provide the data to reproduce this.