enrichplot
 enrichplot copied to clipboard
Getting Enrichment Values of Genes: gseaKEGG, gsearank, and gseaplot2
UPDATE: This is what I am more or less trying to achieve. This is part of the output you get when you run the GSEA software.
Hello everyone,
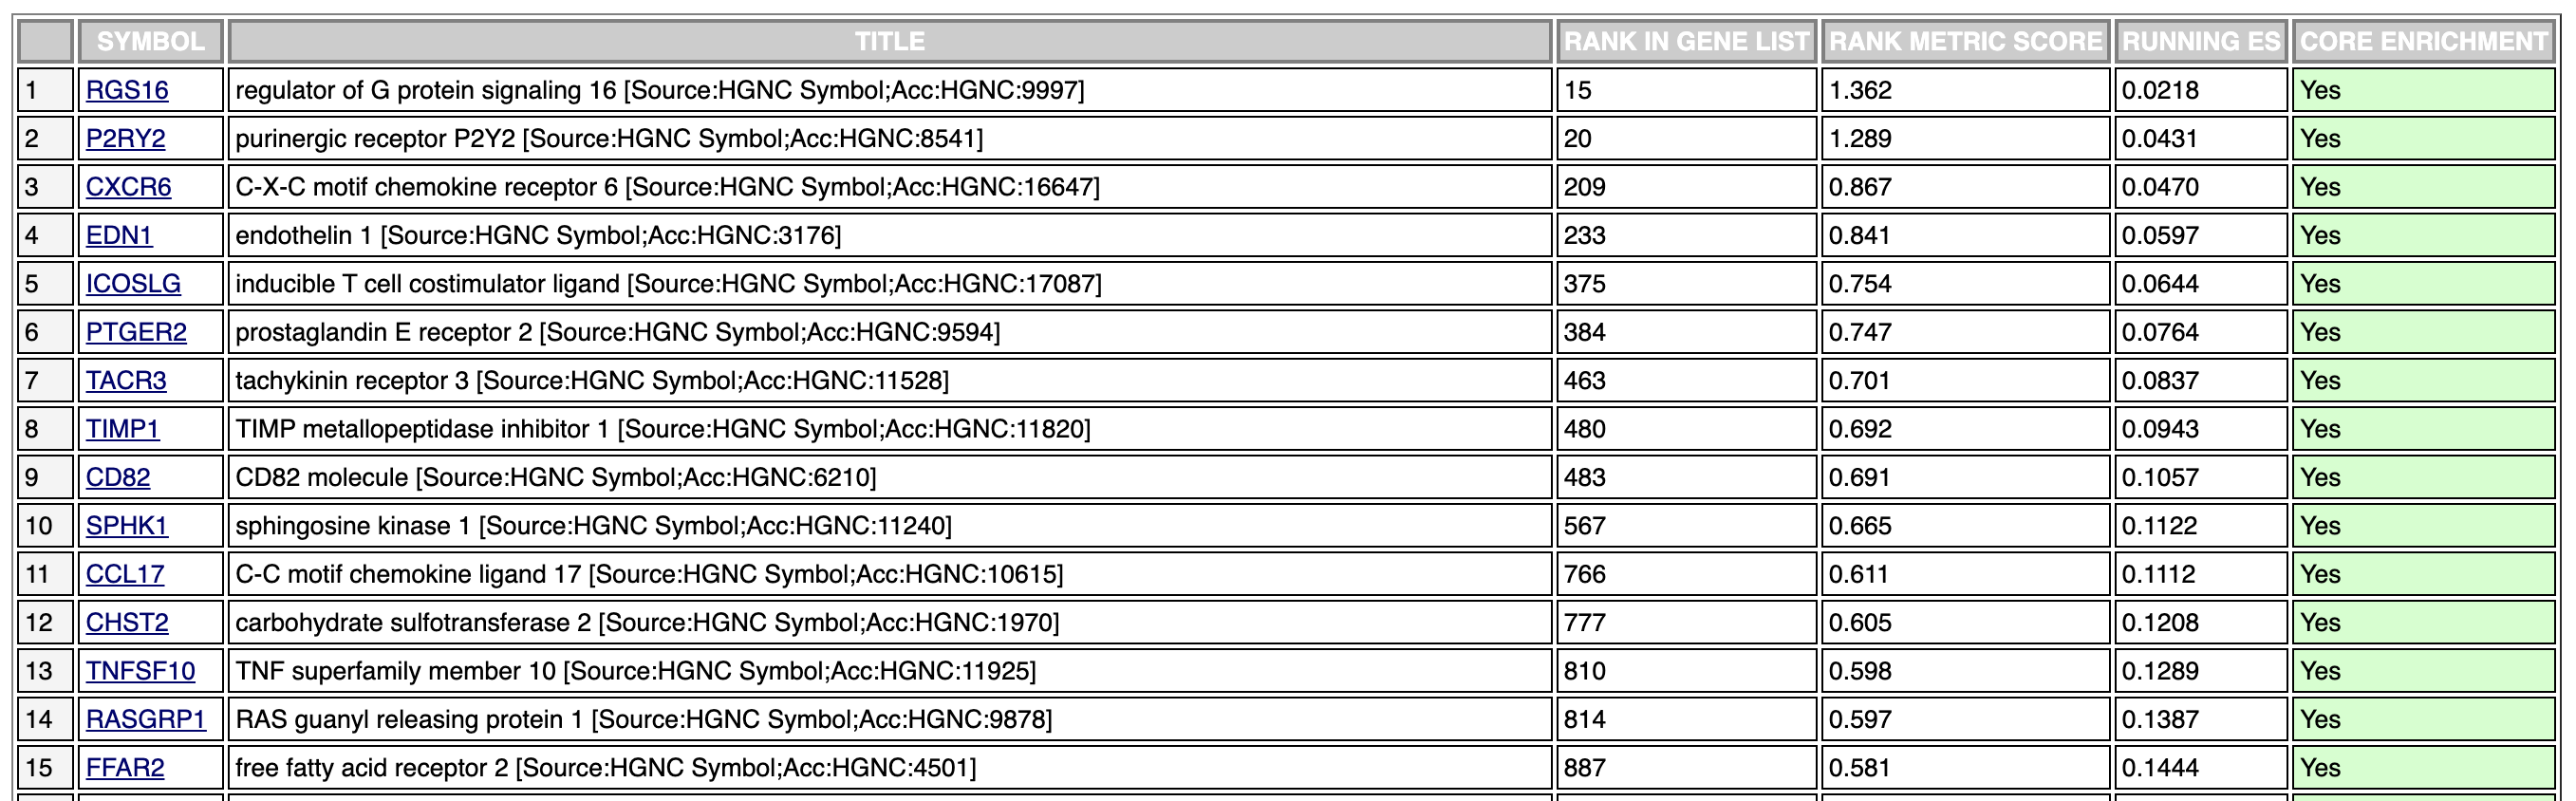
I am trying to pull out the enrichment scores for each gene that is involved in the pathway I am interested in (hsa04621). This is what I have done so far.
I have included gseaKEGG because its part of my pipeline and people may be familar with it. I understand that it is a part of clusterProfiler.
I have a list of 18.2k genes.
head(all.hu.gsea.on)
    25840      6566    389073      2628       745     51313
-2.015503 -1.262359 -1.738641 -1.119760 -1.414289  1.400919
I run gseKegg on this list and find the pathway that I am interested.
gsea.on <- gseKEGG(geneList = huEntrez.on,
                   organism = "hsa",
                   minGSSize = 1,
                   pvalueCutoff = 5,
                   verbose = TRUE)
I turn this into a df for easier readability:
df <- gsea.on@result
ID              |  Description             | setSize enrichmentScore |  NES | pvalue| p.adjust|
hsa04621 | NOD-like receptor signaling pathway | 138 | 0.3703555 | 1.2213326 | 0.095327103 | 0.34003276 | 0.28241236 | 4239 | tags=22%, list=23%, signal=17% | 4938/414325/3449/222545/3449/4938/3456/106
I grab the list of genes:
moreGenes.on <- df[92,11]
[1] "4129/131669/55748/138199/224/84735/223/3067/217/443/501/3034/10841"
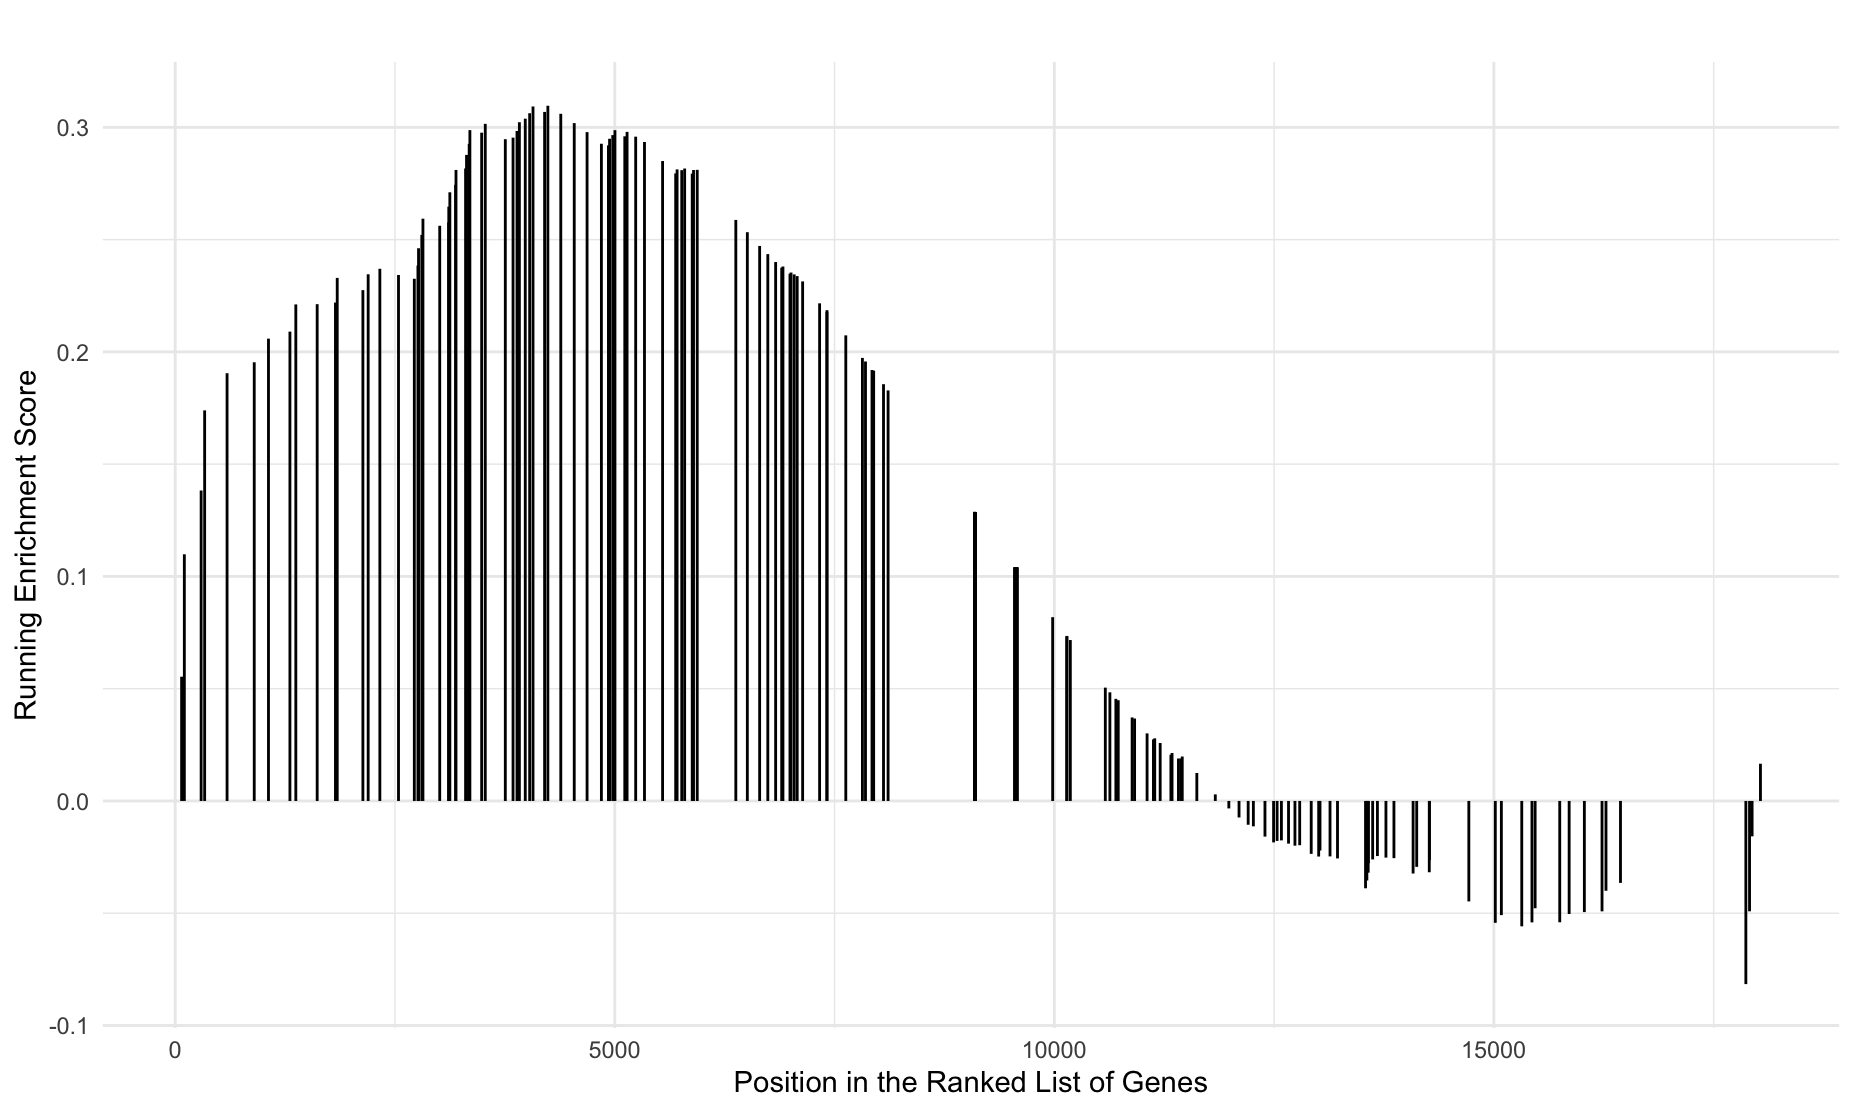
I run gseaplot2 and get a nice graph:
gseaplot2(gsea.on,
          geneSetID = "hsa04621",
          #pvalue_table = TRUE,
          title = "NOD-like receptor signaling pathway",
          )

Now I have the enrichment score for the pathway that I am interested in. Next, I try to get the enrichment score of the genes involved in this pathway.
gsea.rank.on <- gsearank(gsea.on,
         geneSetID = "hsa04621",
         title = "")
I pull out the data tab from the list generated by gsearank:
generankList<- gsea.rank.on$data
head(generankList)
      x runningScore position        ymin       ymax  geneList                         Description
73   73   0.05534286        1 -0.02123215 0.02123215 2.3423271 NOD-like receptor signaling pathway
104 104   0.10986004        1 -0.02123215 0.02123215 2.2183066 NOD-like receptor signaling pathway
295 295   0.13825896        1 -0.02123215 0.02123215 1.5350729 NOD-like receptor signaling pathway
335 335   0.17394468        1 -0.02123215 0.02123215 1.4941962 NOD-like receptor signaling pathway
590 590   0.19049887        1 -0.02123215 0.02123215 1.2065919 NOD-like receptor signaling pathway
899 899   0.19536605        1 -0.02123215 0.02123215 0.8625746 NOD-like receptor signaling pathway
So each row is a separate line on the graph (from what I understand). The geneList column is the logFC values. I have no clue what column 'X' represents.
I took the logfc values in generankList and matched them to my original data in order to get Entrezids. I then eliminated everything that wasn't found in moreGenes.on and transferred over the runningScore from generankList. This seems to have given me what I wanted but I was hoping someone else could chime in as there is probably an easier method.
Final df (first two rows):
| external_gene_name | entrezgene_id | description | runningScore | |
|---|---|---|---|---|
| 1 | NOD1 | 10392 | nucleotide binding oligomerization domain containing 1 [Source:HGNC Symbol;Acc:HGNC:16390] | 0.30155724 |
| 2 | TXNIP | 10628 | thioredoxin interacting protein [Source:HGNC Symbol;Acc:HGNC:16952] | 0.20902577 |
try the following code using the github version of enrichplot.
require(clusterProfiler)
data(geneList, package="DOSE")

x <- gseKEGG(geneList)

require(enrichplot)
id <- 'hsa04110'
gsearank(x, id)


d <- gsearank(x, id, output = 'table')
g = bitr(d$gene, OrgDb='org.Hs.eg.db', fromType='ENTREZID', toType=c("SYMBOL", "GENENAME"))
d2 = merge(d, g, by=1)
d2 = d2[order(d2$`rank in geneList`), ]

head(d2)