react-charts
 react-charts copied to clipboard
No application of chart color per series
Version: 3.0.0-beta32
It's expected that a serie containing a color would be utilized:
{
    label: "Average Ranking",
    data: [
      { primary: new Date("2021-10-01"), secondary: 20 },
      { primary: new Date("2021-10-02"), secondary: 21 },
      { primary: new Date("2021-10-03"), secondary: 22 },
      { primary: new Date("2021-10-04"), secondary: 22 },
      { primary: new Date("2021-10-05"), secondary: 25 },
      { primary: new Date("2021-10-06"), secondary: 25 },
      { primary: new Date("2021-10-07"), secondary: 28 },
      { primary: new Date("2021-10-08"), secondary: 29 },
      { primary: new Date("2021-10-09"), secondary: 29 },
      { primary: new Date("2021-10-10"), secondary: 30 }
    ],
    secondaryAxisId: "2",
    color: "#81bea6"
  }
But the UI doesn't show the color.
Please refer: https://codesandbox.io/s/chart-color-issue-l0fqv
Luckily, I have found a workaround.
You can use the defaultColors options prop of the Chart and add a color for each serie (correct me if terms are wrong).
Let's keep this open as the the original issue does persist.
Running into the same issue, I am on [email protected]. Seems there is another slight bug with your suggested workaround in that each series is offset from the center tick on the x axis making the alignment look not too great.
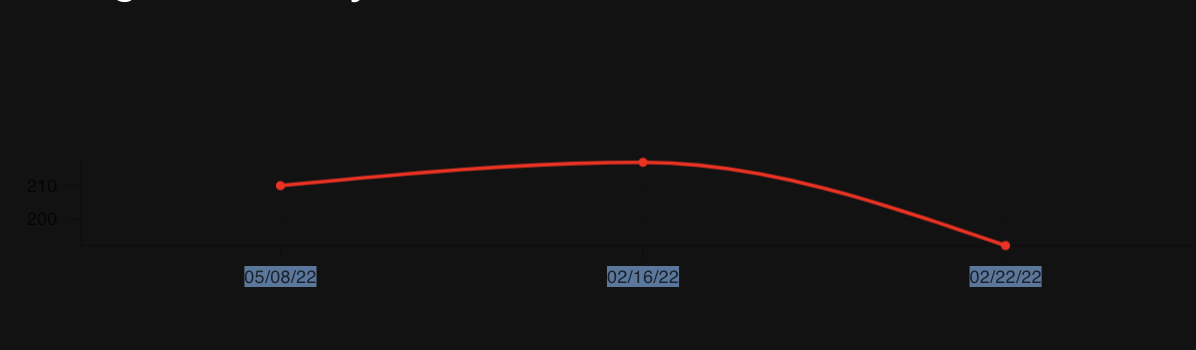
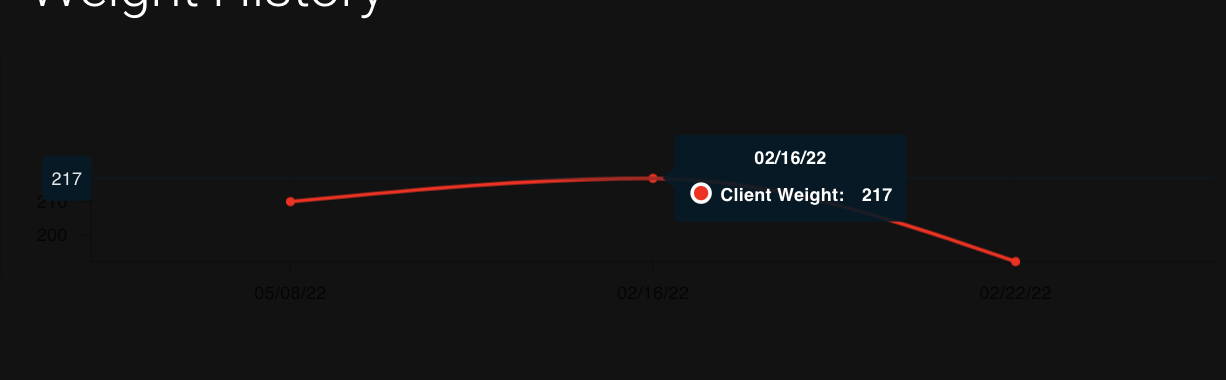
@j-sup It looks like using defaultColors does change the graph, but not the ticks. Any idea how to change the color of the data ticks?
Image for reference, has the ticks selected to show. They do not show normally.
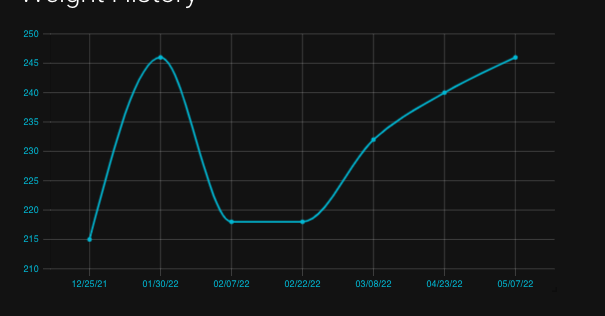
Was able to fix my issues specifically with CSS / styled components for anyone interested.
const ChartContainer = styled(ResizableBox)`
  & .tickLabel {
    fill: blue;
  }
  & .tick {
    & line {
      stroke: blue;
      stroke-width: 0.2px;
    }
  }
`

<ChartContainer>
   <Chart
    options={{
      data,
      interactionMode: 'closest',
      defaultColors: ['blue'],
      primaryAxis,
      secondaryAxes
    }}
  />
</ChartContainer>