Muhammad Mubashirullah Durrani
![]()
Muhammad Mubashirullah Durrani
I too desire a custom tool tip. I have a scenario where the x-axis content isn't the data I want to show. Example scenario is I have two date range...
Looking forward to [it](https://www.decisionfoundry.com/tableau-consulting/articles/tableau-hacks-plot-different-date-ranges-on-the-same-axis/). 
 Currently, there is this tr overflow x clip that was set to clip. Setting it to auto is my desired behaviour. I cant change this by myself. I think...
Wrapping my TabList in a div with id tab works. ``` #tab ol { overflow-x: auto; overflow-y: hidden; } ``` 
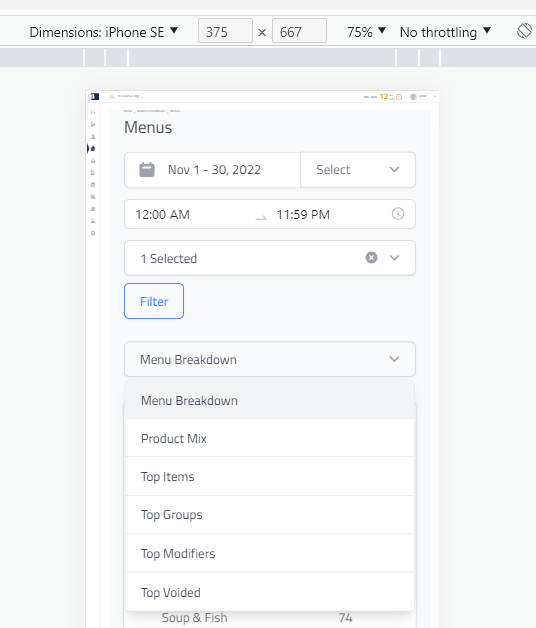 ```jsx setSelectedView(value)} marginTop="mt-6"> setSelectedView(value)} marginTop="mt-6"> ``` This certainly is more cooler. Thank you so much for making Tremor. It has made it possible to make analytics for our product...
Unless this merges, the app will crash.
### High priority issue This could be a breaking problem and if not addressed would require us to migrate to a different solution. > [Deprecation] Listener added for a 'DOMNodeInserted'...
We've migrated away from react quill. There were many options, my colleague went to quill directly and used that.