resharper-unity
 resharper-unity copied to clipboard
Coroutines are marked as performance critical context
Almost all coroutines are marked as performance critical context. Often this does not seem justified. E.g.:
// Called from Start()
private IEnumerator PlaySoundSequence()
{
     yield return new WaitForSeconds(delay);
     PlaySound(sound);
}
Seemingly randomly some are not marked. What's the pattern here? Should this be the case?
There is definitely an argument to improve detection around coroutines and performance critical context - but it depends on what the coroutine itself does. Without the WaitForSeconds, this could easily be called every frame which would make it performance critical. It's on the radar.
But there shouldn't be some coroutines that are marked performance critical and others that aren't. Could you provide some more details, please? Are the signatures different? Are they invoked on the same class, in the same file? Are there any differences in the method they're started in?
I couldn't really see a pattern when they are marked critical and when not, unfortunately. So it seemed buggy to me.
But personally I would only consider coroutines with a loop that has a yield return null or 0 performance critical.
So I'd rather not have marked coroutines at all than generally all of them.
There is definitely an argument to improve detection around coroutines and performance critical context - but it depends on what the coroutine itself does. Without the
WaitForSeconds, this could easily be called every frame which would make it performance critical. It's on the radar.But there shouldn't be some coroutines that are marked performance critical and others that aren't. Could you provide some more details, please? Are the signatures different? Are they invoked on the same class, in the same file? Are there any differences in the method they're started in?
No. This assumption is very wrong, I'm sorry to say. Coroutines by their nature with or without WaitForSeconds are NOT performance critical context.
The MOST coroutines in a Unity project are designed and implemented as "one shot" or "one go" sequence of events. They don't loop by default and they are not called by Unity every frame.
The ONLY coroutines which can be considered as performance critical context are the ones which contains an infinite or long running loop such as "while(true)" or "while(ElapsedSeconds == 10000)".
Assuming all coroutines as performance critical context is very very wrong. Like I said above... MOST coroutines are implemented as "one go" sequence of events; not as infinite or long running loops.
If you are going to make Resharper to mark a coroutine as performance critical context, you should try to detect if there is any infinite or long running loop inside of it.
Please don't ignore my explanation above.
Thank you for your great effort developing and maintaining Resharper Unity plugin for the community.
Any update on this? At least, a comment on my well detailed explanation?
Thanks for the comments, and sorry for not replying sooner. Can you explain what you mean by a "sequence of events"? If this is do some work, yield, do some work, yield, etc. then this is the intention behind marking it as performance critical - the execution of the method is spread over several frames, called after finishing Update. So it's using up frame budget, and therefore it's best to avoid expensive methods here, such as GetComponent. This is what the performance critical context will highlight. It's saying that this method is being called as part of your frame budget and tries to show known expensive methods.
At least, that's the theory. This explanation doesn't take into consideration how many steps are in the sequence, or how long the coroutine yields for. If there are only a couple of steps, is it ok if one or more of them call expensive APIs? What about if there are hundreds of steps, but they're called once a second? Is it ok to call something expensive here? So nothing is set is stone, and we're happy to review this.
We're too close to the 2021.1 release to make a change for this release, but with 2021.1, you can click the "Frequently called" Code Vision link and select the "Disable performance analysis for this method", which will add a comment that disables the "Frequently called" and any performance analysis in this method, and any called methods.
@citizenmatt I think most of the time coroutines are harmless and not used as an Update substitute. So it should either check if expensive invocations are inside a loop inside a coroutine, or consider coroutines as harmless by default, but let us mark them as expensive. Also, usually, when coroutines are started, it's a one-off, even when their execution (over time) is expensive. So maybe marking coroutines as expensive is practically never useful (I wouldn't start a coroutine every frame, for example).
@citizenmatt Yes. You described the "sequence of events" correctly and you are right about the coroutines using up the frame budget but this alone is not enough for calling a coroutine a performance critical context; not for most cases at least.
For example, If we call GetComponent only once in the beginning of a coroutine, then if we start a long running loop, and if we don't call any expensive method such as GetComponent in the loop, that would totally be a perfect implementation because the expensive stuff is performed once outside of the loop.
If you can detect that there is a long running loop in the coroutine, only then you can consider that the loop itself in the coroutine is critical context; not the beginning part of the coroutine which is outside of the loop.
This is exactly the case with Start and Update methods even without using coroutines.
You are allowed to call GetComponent in Start because Start is actually the beginning of the update loop but you shouldn't call GetComponent in Update method because Update method is inside of a long running loop. Just like I described in my coroutine example above.
As a summary, considering ALL coroutines as a critical context without analyzing their structure is wrong.
I love Resharper and its warnings/errors/suggestions. That's why I'm here writing all these comments but unfortunately, I had to disable one of them recently and it's the one showing coroutines as critical context. :( I don't want to disable it because I believe it provides help in general but unfortunately, it's marking my harmless coroutines as critical context and I get error messages for no valid reason so it has to remain as disabled :(
I know that analyzing the structure of a coroutine would be very hard but, at least, you need to give us a way to declare that "this" coroutine is NOT a critical context or something. Maybe an attribute we can decorate the coroutine method with.
Until you provide us an option, I have to keep this feature disabled because it's producing false errors :(
Thanks again for the comments. I very much appreciate the context - it's a great help in deciding what to do, and I'm pretty confident we'll stop treating coroutines as performance critical in 2021.2.
To follow up on a couple things - Rider 2021.1 allows marking a coroutine as NOT "performance critical" by adding a special comment (click the "Frequently called" Code Vision marker). Secondly, the highlights for expensive methods are not errors, and deliberately so.
There's more detail in the wiki page, but the gist is that they are informational highlights, and not rendered or registered as errors, warnings or even suggestions. The point is that your code isn't "wrong", we're just drawing your attention to the fact that you're calling something expensive, in a place where you want to be careful calling expensive things. It's up to you to decide if it's right or wrong.
If we did treat them as errors or warnings, then in some cases, such as calling SendMessage in Update, where there's no easy fix, we'd be showing errors for something where the cost of fixing is too great for right now, and effectively encouraging you to ignore warnings, and that's not something we want at all.
And it's definitely informational, rather than definitive. It's not viable for Rider to do a deep analysis of the code - if there's a call to GetComponent inside an if statement, Rider doesn't know if that condition will be true on every call or just once, but we still highlight it. Similarly, Rider doesn't know the impact of calling an expensive method - if you call Find in an Update for a component that's only used in a config screen, then maybe that's an acceptable cost. But it's still an expensive method call, and we highlight it. The highlights are intended to give you a heads up so you know what's going on, rather than telling you something is wrong. They are not a substitute for profiling.
This model is essentially the same as the HeapView allocations viewer plugin, which highlights many "hidden" allocations. They're not wrong, but highlighting that you've got boxing, params array allocations, lambda capture allocations and so on going on. More information to help you reason about your code, and give you a visual indication that you can use to decide to investigate further.
Thank you for explanation.
I'm using VS, not Rider. Is the same "NOT critical via a comment" option available in VS Resharper?
Everything is an error for me. Please see the screenshot.

I'm one of the rare people who uses Solution Wide analysis in all projects. Solution Wide analysis only displays errors, not others. My code has to be perfect and I must see the green resharper checkmark. For that reason, every code analysis report is set as an error. I would keep "performance critical context" report as enabled and as an error if it wasn't marking coroutines incorrectly. Then, I would be able to see misusages in the Solution Wide analysis as a red icon so I would know I made a mistake ("error") in my code. But for now, that's not possible for "performance critical context" report.
Again, I'd like to know if that "comment" option is available in VS Resharper.
Wow! That's pretty hardcore :grin: You can enable warnings in the Solution Wide Analysis, which might allow you to go back to defaults, and still get the benefits of the SWA tool window.
If you change the severity of the performance indicators (C# -> Unity performance indicators) then they will show up as errors or warnings, but the default setting is just a highlight, which doesn't appear in the SWA tool window. I'd recommend resetting the severity of these indicators so they don't interfere with the other warnings and errors.
And yes, the comment option will be available in ReSharper 2021.1, in the alt+enter menu. The EAP for ReSharper is available, but the Unity plugin currently isn't.
Yea. That option is already enabled on my Resharper but it's not enough. I even changed lots of suggestions to errors too. I am very strict about my code style rules so, something is either Good or Bad so, either it's an error or hidden completely. I won't lie. I have few things set to suggestions such as "reference may be null" type of things but they are very limited in number.
Can you give me an example usage of that "comment" option in action please?
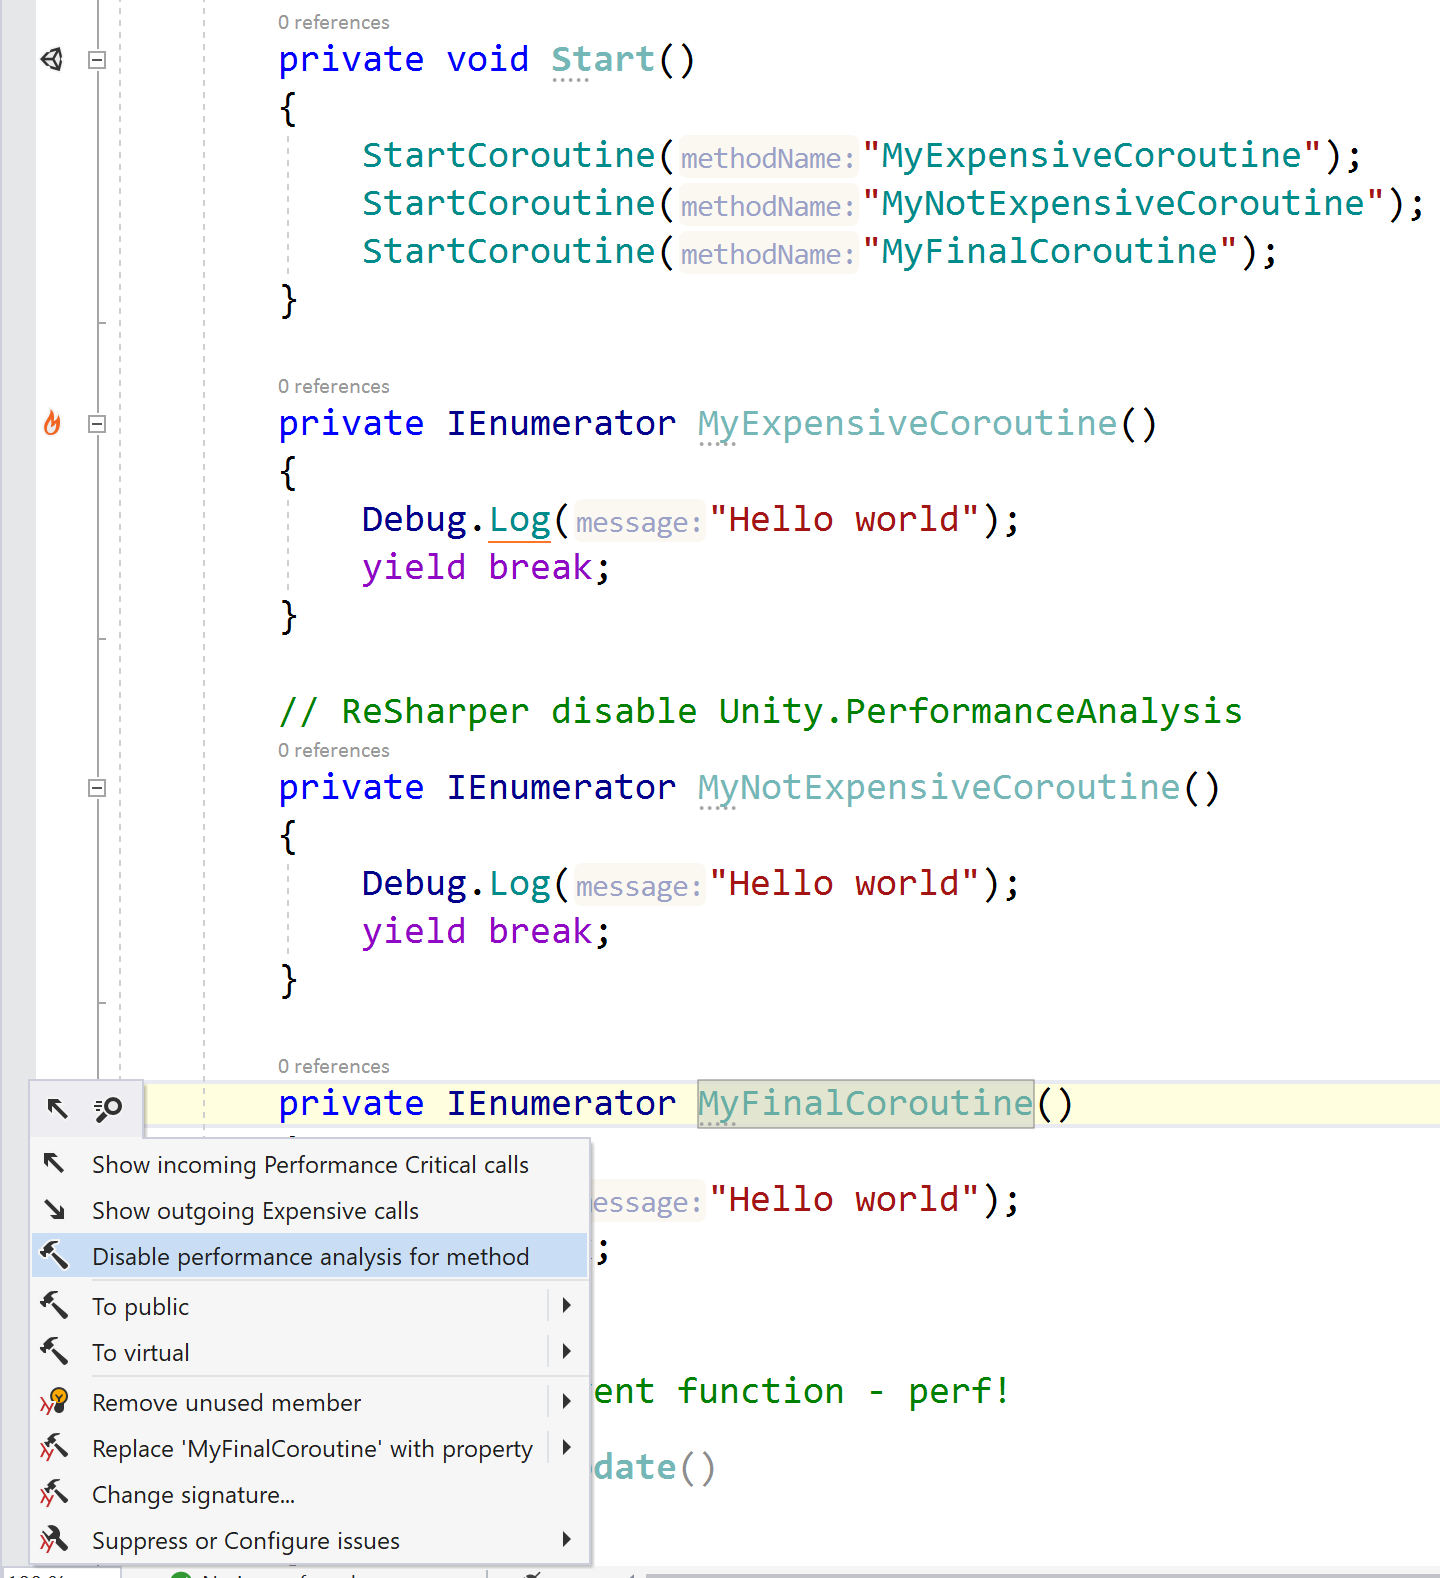
Sure, here you go. ReSharper highlights MyExpensiveCoroutine as a "hot method" with a nice little flame icon. The comment on MyNotExpensiveCoroutine (I'm good with names) stops the analysis. Any methods called from MyExpensiveCoroutine would also be marked as "hot", but methods from MyNotExpensiveCoroutine won't be.
You can see the alt+enter menu with the item to disable the analysis. This adds the comment.