immunarch
 immunarch copied to clipboard
Gene usage plot
Hi there,
I am working on 10X scTCR data lately. Here I got a problem, after I loaded my 10X data into immunarch, it would store paired info (alpha and beta chain) like the picture blow

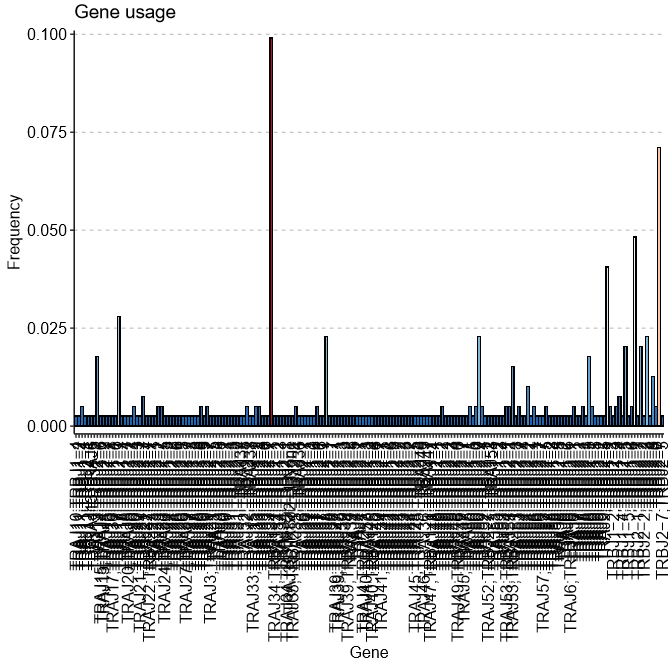
Consequently, when I caculate the V/J gene usage, the x axis would show all V/J combination rather than each single V/J gene usage which in my opinion using hitmap can get a more intuitive display.

So is there any tricky way to show one gene in one column or else to handle the input before plot.
Hi @crushseven-7
Thank you opening a ticket!
In case of the heatmap, what would be the output for the input groups of repertoires? Heatmap would work greatly on a single repertoires, but what if you get a group of them?
Would you like to count occurrences separately for V and J genes? What would you like to see the results of the plot – two plots one for V and for J? Or would you like to choose what gene to count?
Thank you for your response. As you said, heatmep may just suitable for a single sample. Maybe plot a heatmap for each repertories?
As for geneusage, as shown in the below picture. In the geneusage function, I fill up with 'hs.trav' in the .gene parameter. Consequently I would expect each row would be one kind of trav gene in the output dataframe. In this way, the plot will be better looking.

I agree with crushseven-7. It would be really useful to plot the single V/J gene usage instead of the combinations. My analysis also included "None" as part of the combinations (e.g. bottom right on the image). That is worth fixing.
Sometimes the sequencing data lacks all the combinations of light+heavy (BCR) or alpha+beta(TCR) chains which precludes the interpretation of such combination plots.

Immunarch looks great and I would be happy to use it in the future once this is fixed.