readgssi
 readgssi copied to clipboard
Interoperability with PyVista
This project looks really promising! Next time I'm working on a project with GPR data, I'm going to have to use this!
I saw that this project reads data from the DZT format - correct me if I'm wrong, but those files have XYZ trace locations in the header, right? If this project can read all that data, perhaps we could collaborate on making an interface between this softaware and vista: https://docs.pyvista.org for 3D rendering of many GPR lines.
I've done this before and I am envisioning a way to make figures like these with ease:
This software does read DZT files and has the ability to read DZG as well, which are basically ASCII text files with NMEA GPS strings in them. I think all of the control units produced after the SIR-3000 have the ability to interface with a NMEA GPS and create DZGs. readgssi doesn't read the trace locations from the header at the moment*, but I think this could be done with the lat/lon/elev values in the DZG. What would vtki need in terms of input? Seems like it would not be too difficult to pass an array of XYZ and a radar array through vtki to create something like your example.
*Some unnecessary background: I've always understood the location section of the header to be of limited length (either 944 or 1024 bytes if I remember correctly), meaning that it could only store so many XYZ couplets before running out of room. Since my lab group works with pretty long transects (hundreds of meters to tens of km in many cases) I decided to read the simpler and more reliable DZGs instead. But perhaps I was wrong about that section of the header?
Thank you also for the kind words! The motivation behind this was largely so that I could create nice figures quickly from the command line without using RADAN and I'm glad that others are finding uses for it too.
What would vtki need in terms of input? Seems like it would not be too difficult to pass an array of XYZ and a radar array through vtki to create something like your example.
We don't need much to recreate that visualization with any given data. All we need are:
- XYZ coordinates at every trace (numpy array of
n_tracesby3) - a 2D array of the recording (
n_tracesbyn_samples) - a
dtordsvalue (the separation in depth or time* between each sample)
Then I have some scripts I could generalize to make spliny-surfaces like what's shown above
*I often visualize pre-processed/pre-depth-migrated data where the Z axis represents time
This sounds both doable and worth it. I'm not sure of the timeline yet but I think it would only be a few lines of code. Thank you for the idea.
This sounds both doable and worth it. I'm not sure of the timeline yet but I think it would only be a few lines of code.
Indeed, I think this would only be a few lines of code. If you could provide a sample data file and a Python example snippet using your package here to read and plot that data file, I could implement the rest in a pull request
FYI: we recently had to change the name of vtki to pyvista per https://github.com/pyvista/vista/issues/208
FYI: we recently had to change the name of vtki to vista per pyvista/vista#208
Good to know, thanks!
Indeed, I think this would only be a few lines of code. If you could provide a sample data file and a Python example snippet using your package here to read and plot that data file, I could implement the rest in a pull request
@banesullivan try this: DZT__004.tar.gz
from readgssi import readgssi
hdr, arr, gps = readgssi.readgssi(infile='DZT__004.DZT', zero=[233], bgr=True, win=500,
                  freqmin=60, freqmax=100, normalize=True, x='m', z='m', epsr=80,
                  plotting=8, title=False)
If you want to see header and processing details, add verbose=True.
Make sure whatever environment you execute this in has scipy=1.3.0 or later. The filtering fails in 1.2.1 for reasons I can't quite figure out.
Apologies fot taking a long time to get around to this....
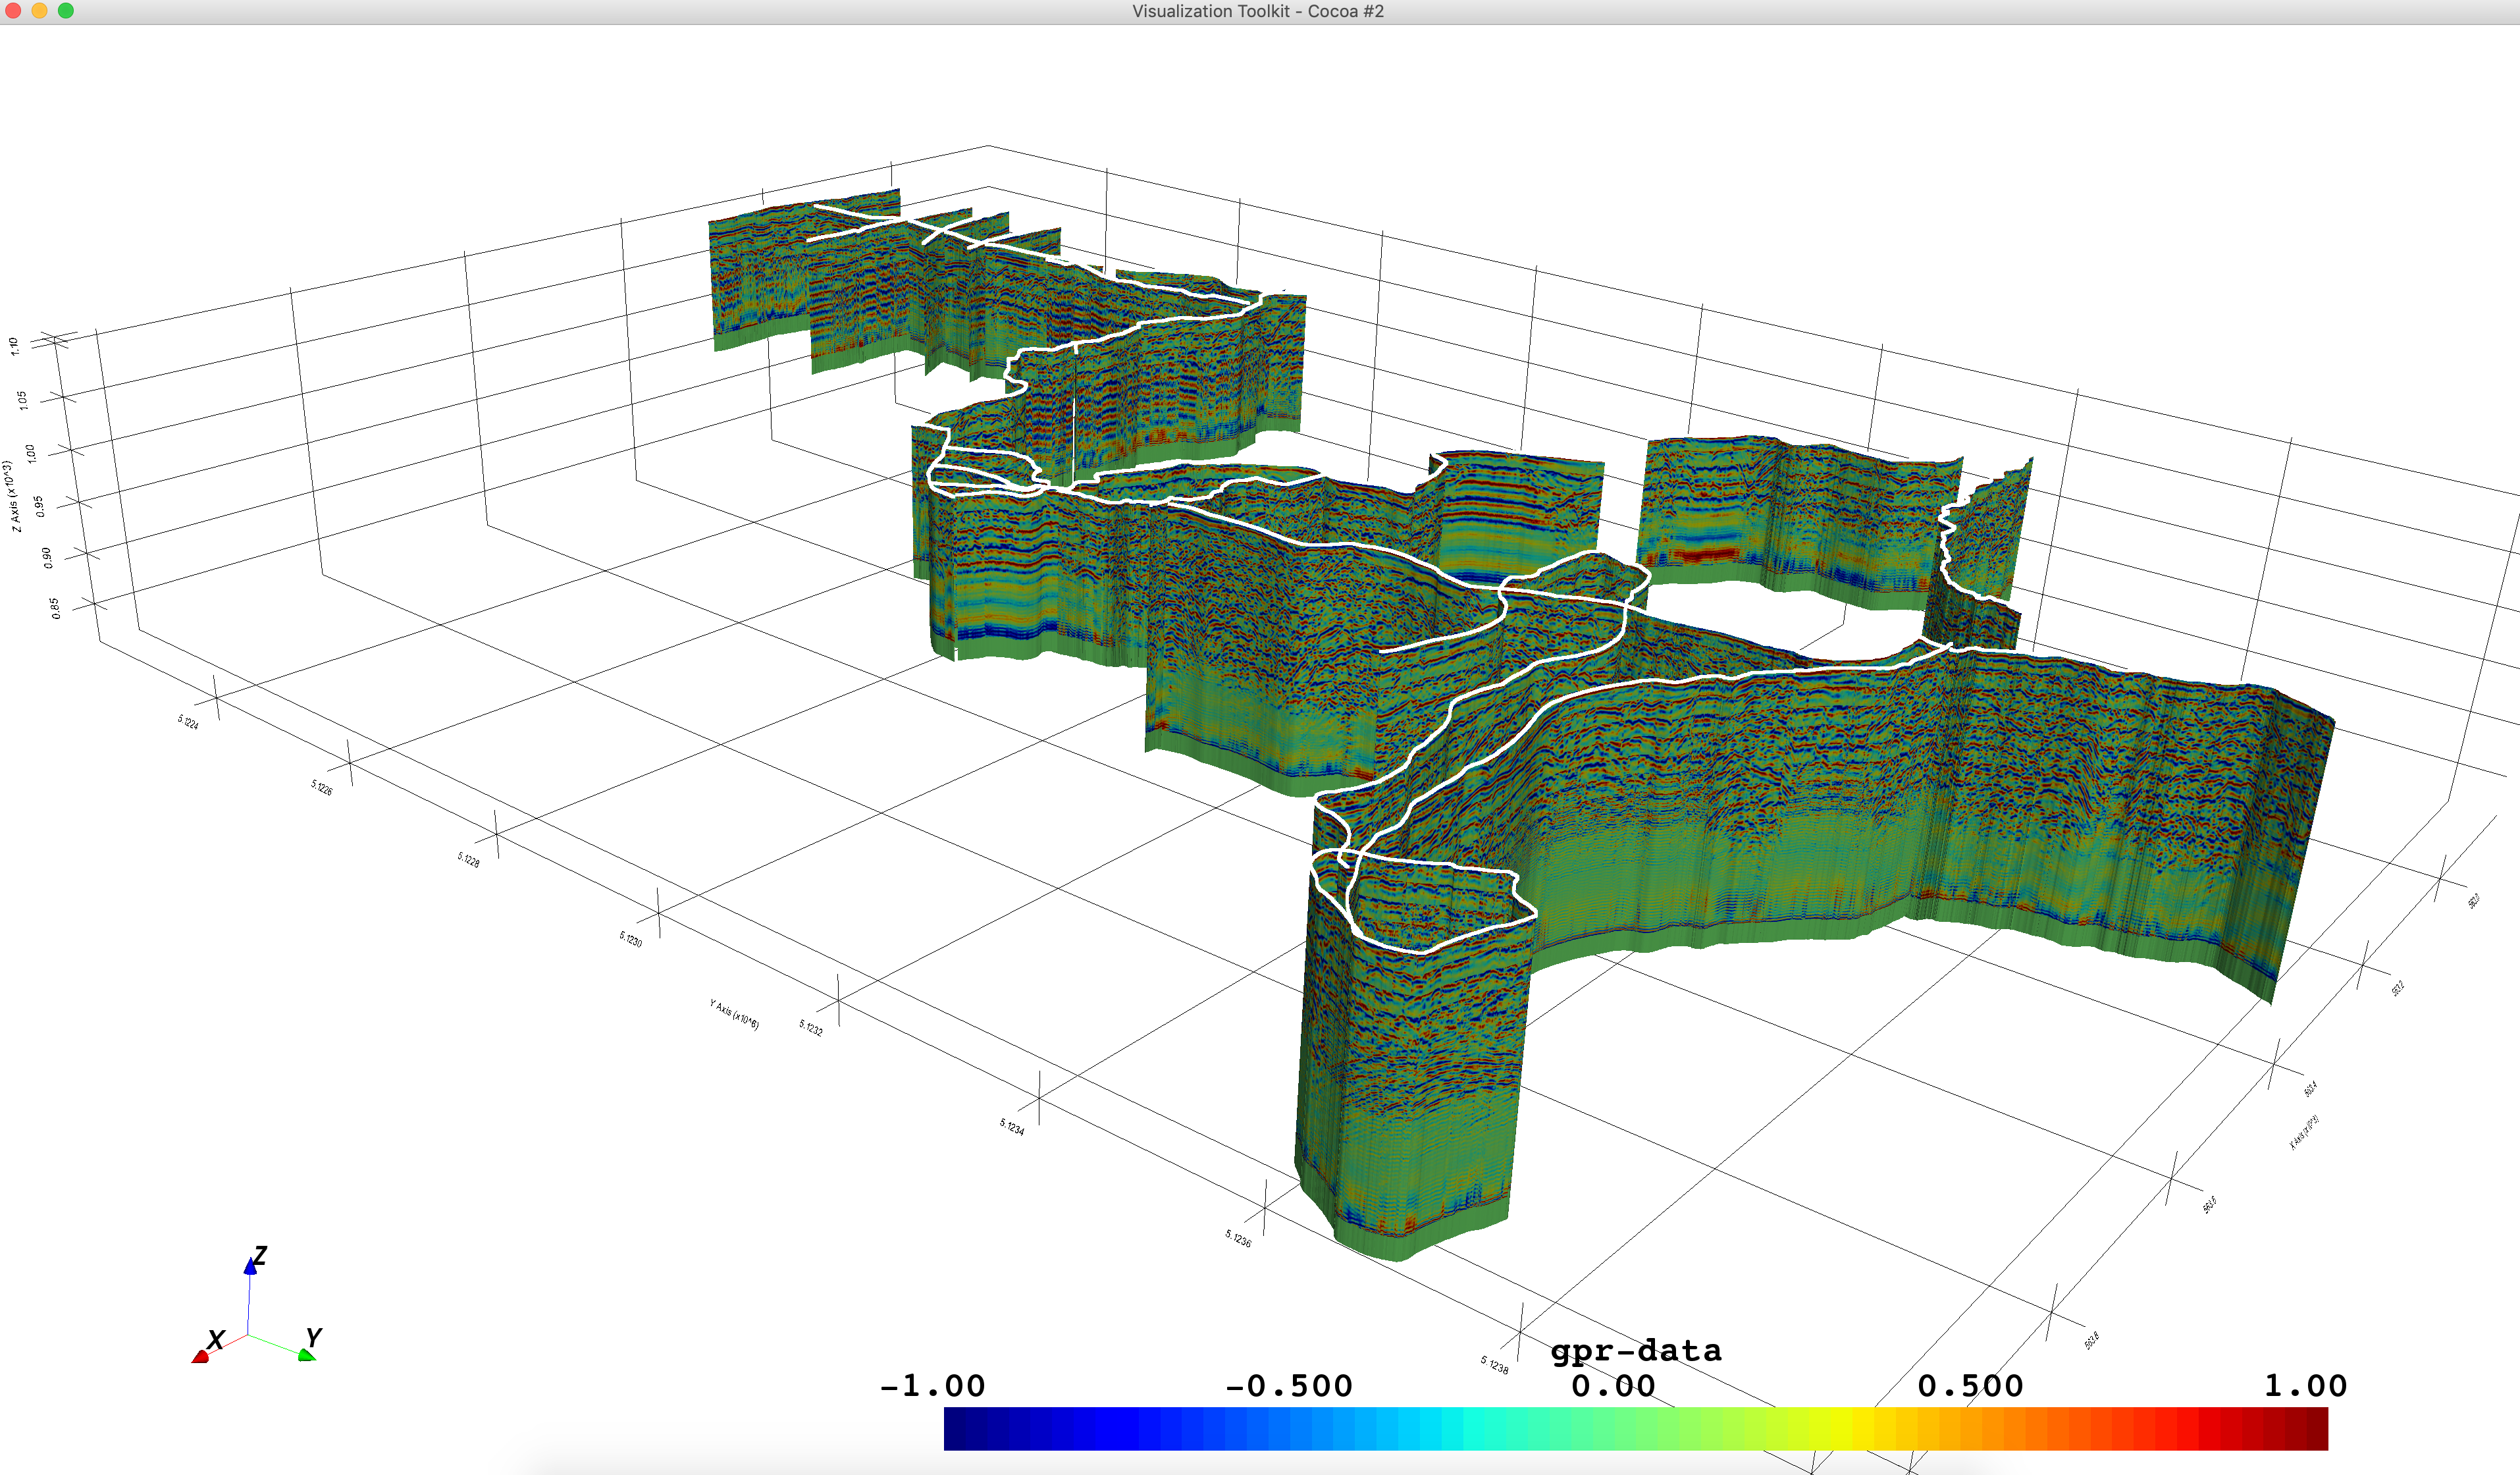
Here is a way to visualize that data in 3D using PyVista which could be generalized for any GSSI dataset.
Note that I had to convert the lat/lon to UTM and used the utm package because it's super easy. There are probably better alternatives.
Also, I had to interpolate the GPS coordinates to give every trace a coordinate - I used a smooth spline but not all users might want that.
import pyvista as pv
import numpy as np
from readgssi import readgssi
import utm
import scipy

pv.set_plot_theme('document')

hdr, arr, gps = readgssi.readgssi(infile='DZT__004.DZT',
                  zero=[233], bgr=True, win=500,
                  freqmin=60, freqmax=100, normalize=True,
                  x='m', z='m', epsr=80,
                  plotting=8, title=False)

x, y, _, _ = utm.from_latlon(gps['latitude'].values, gps['longitude'].values)
z = gps['altitude'].astype(float).values
collar = pv.PolyData(np.c_[x,y,z])

zscale = 1

# Grab the GPR data as a 2D array
data = arr[0]
ntraces = data.shape[1]
nsamps = data.shape[0]

# Grab the coordinates each as 1D arrrays
x, y, _, _ = utm.from_latlon(gps['latitude'].values,
                             gps['longitude'].values)
z = gps['altitude'].astype(float).values
# Interpolate the path
tck, u = scipy.interpolate.splprep([x,y,z], s=5)
x_knots, y_knots, z_knots = scipy.interpolate.splev(tck[0], tck)
u_fine = np.linspace(0,1,ntraces)
x_fine, y_fine, z_fine = scipy.interpolate.splev(u_fine, tck)
path = pv.PolyData(np.c_[x_fine, y_fine, z_fine])

# Create the depth vector and scale it
maxd = hdr['rhf_depth']
z_range = np.linspace(0, maxd, nsamps) * zscale
# repeat the Z locations across
tp = np.repeat(z_range.reshape((-1, nsamps)), ntraces, axis=0)
tp = path.points[:,2][:,None] - tp
points = np.repeat(path.points, nsamps, axis=0)
points[:,-1] = tp.ravel()

# Make a surface to place the GPR data on
surface = pv.StructuredGrid()
surface.points = points
surface.dimensions = (1, nsamps, ntraces)
# Associate the GPR data to that surface
# Note the FORTRAN RAVELING
surface.point_arrays['gpr-data'] = data.ravel(order='F')

# Visualize now!
p = pv.Plotter(notebook=False)
p.add_mesh(path)
p.add_mesh(collar, color='red')
p.add_mesh(surface, scalars='gpr-data', cmap='gray',)

p.add_axes()
p.show_grid()
p.show()

And one pretty exciting new feature coming soon to PyVista is the ability to trace out profiles on meshes (ref https://github.com/pyvista/pyvista/pull/362 and https://github.com/pyvista/pyvista/issues/295). It'd be great if we could land a to_pyvista method here in readgssi with the upcoming point selection features in PyVista to make horizon picking a breeze - for example:
p = pv.Plotter(notebook=False)
p.add_mesh(path, pickable=False)
p.add_mesh(collar, color='red', pickable=False)
p.add_mesh(surface, scalars='gpr-data', cmap='gray',
           pickable=True)

def make_ribbon(path):
    if path.n_points < 2:
        p.remove_actor('horizon')
        return
    ribbon = path.ribbon(normal=(0,0,1))
    p.add_mesh(ribbon, name='horizon', color='blue',
               opacity=0.75, pickable=False)
p.enable_path_picking(make_ribbon)

p.add_axes()
p.show_grid()
p.show()

Holy cow, great work. This looks wonderful. I don't have time to add documentation or a new method right now because I just started a new job but this is really exciting and I will get to it as soon as I can. Bravo!