ggmagnify

ggmagnify copied to clipboard
Can't reproduce tutorial figure
I can't reproduce the example figure used in tutorial to plot an inset. I used the same code, just removed the shadow part.
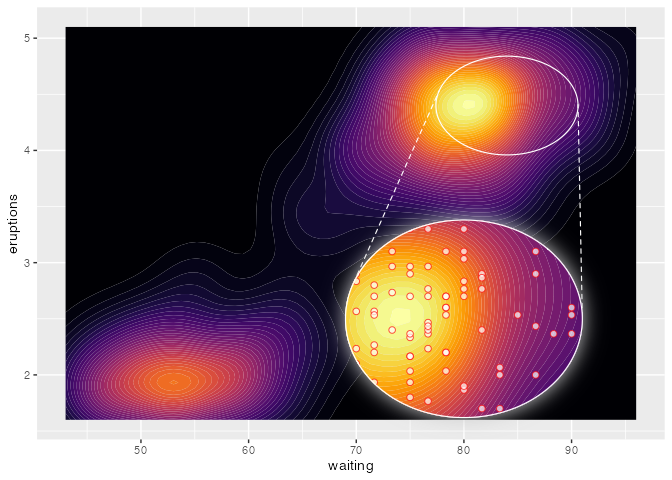
Current figure:
library(ggmagnify)
library(ggplot2)
#> Warning: package 'ggplot2' was built under R version 4.3.3

booms <- ggplot(faithfuld, aes(waiting, eruptions)) +
  geom_contour_filled(aes(z = density), bins = 50) +
  scale_fill_viridis_d(option = "B") +
  theme(legend.position = "none")

booms_inset <- booms +
  geom_point(data = faithful, color = "red", fill = "white", alpha = 0.7,
             size = 2, shape = "circle filled") +
  coord_cartesian(expand = FALSE)

booms + geom_magnify(from = c(78, 90, 4.0, 4.8),
                     to = c(70, 90, 1.7, 3.3),
                     colour = "white",
                     plot = booms_inset)

Created on 2024-08-27 with reprex v2.0.2
Desired figure (from tutorial):
sessionInfo()
#> R version 4.3.2 (2023-10-31 ucrt)
#> Platform: x86_64-w64-mingw32/x64 (64-bit)
#> Running under: Windows 10 x64 (build 19045)
#>
#> Matrix products: default
#>
#>
#> locale:
#> [1] LC_COLLATE=Portuguese_Brazil.utf8  LC_CTYPE=Portuguese_Brazil.utf8
#> [3] LC_MONETARY=Portuguese_Brazil.utf8 LC_NUMERIC=C
#> [5] LC_TIME=Portuguese_Brazil.utf8
#>
#> time zone: Etc/GMT+3
#> tzcode source: internal
#>
#> attached base packages:
#> [1] stats     graphics  grDevices utils     datasets  methods   base
#>
#> loaded via a namespace (and not attached):
#>  [1] styler_1.10.2     digest_0.6.33     fastmap_1.1.1     xfun_0.43
#>  [5] magrittr_2.0.3    glue_1.6.2        R.utils_2.12.2    knitr_1.46
#>  [9] htmltools_0.5.8.1 rmarkdown_2.26    lifecycle_1.0.4   cli_3.6.1
#> [13] R.methodsS3_1.8.2 vctrs_0.6.4       reprex_2.0.2      withr_3.0.0
#> [17] compiler_4.3.2    R.oo_1.25.0       R.cache_0.16.0    purrr_1.0.2
#> [21] rstudioapi_0.16.0 tools_4.3.2       evaluate_0.23     yaml_2.3.8
#> [25] rlang_1.1.2       fs_1.6.3
Created on 2024-08-27 with reprex v2.0.2
I think you forgot
shape = "ellipse".
Yes, I mean the plot area inside the inset plot
So your device settings may be different. You may also want to use inset_theme().