Lock-up and consumes all RAM
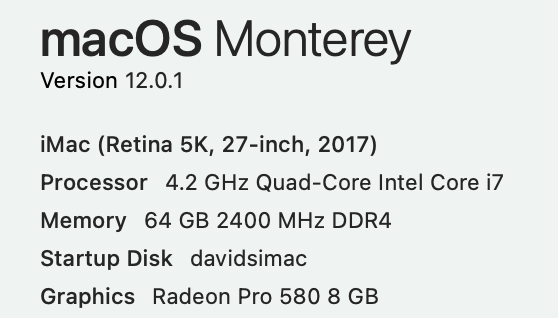
Model Name: iMac (Retina, 5K, 27-inch, 2017) macOS Version: 12.0.1 App Version: 2021.12 (2021.322) Safari Version: Version 15.1 (17612.2.9.1.20)
Home Assistant Core Version 2021.12.3
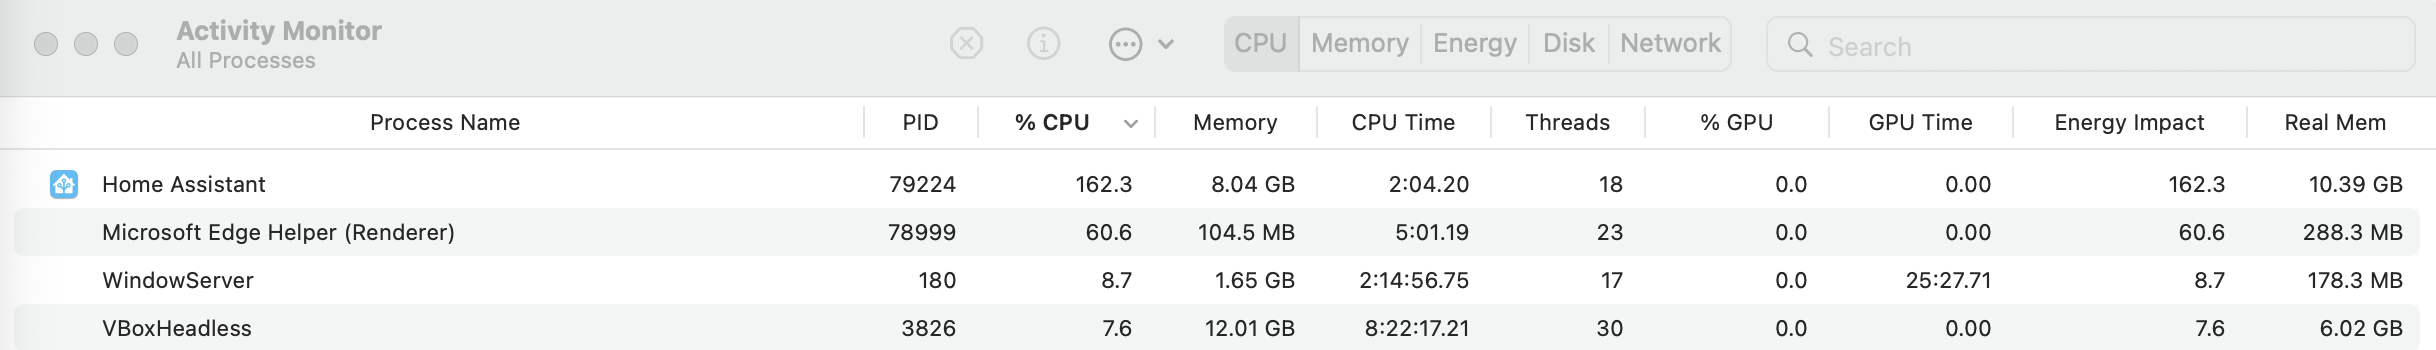
Describe the bug Application locks up and (eventually) consumes all RAM.
To Reproduce Access http://homeassistant.dcmartin.com:8123/
Expected behavior Not lock-up; not consume all RAM
Screenshots
Additional context Contact me directly ([email protected]) to gain access to server running http://github.com/motion-ai/motion-ai YAML configuration.
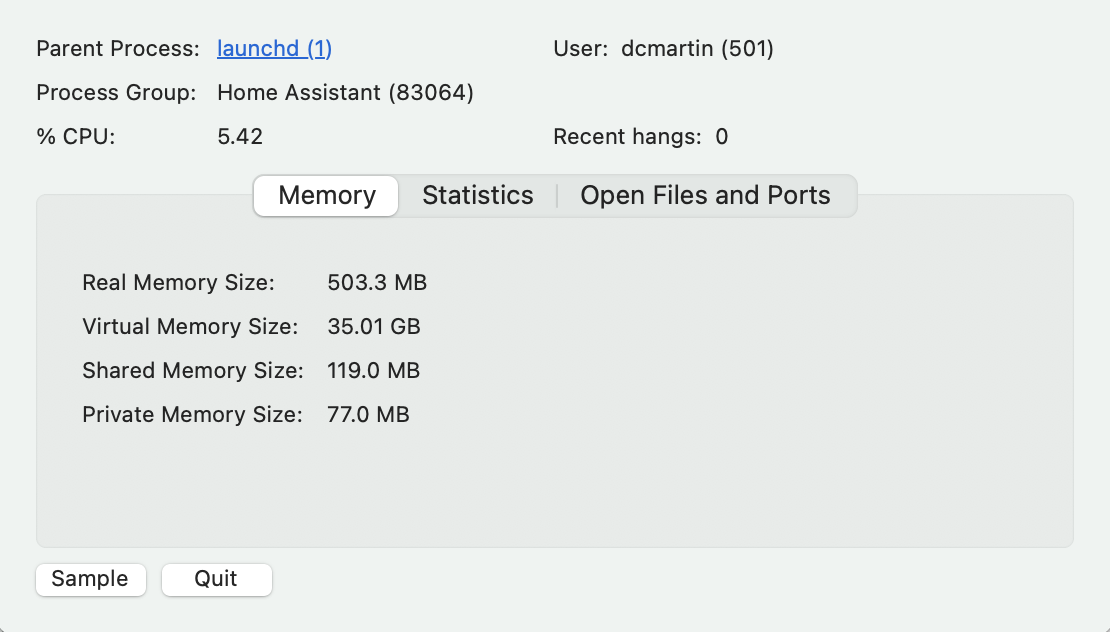
Can you double-click on the entry in Activity Monitor and run a "Sample" on it? That should give some insight into what it's stuck on, and why.
I am aware of a rare Catalyst-specific issue that occurs that looks like this (high CPU usage, high memory usage) but generally does not reproduce reliably.
FWIW, it has happened with my Motion-AI solution for a long time; I just didn't bring up the issue :-)
I do not have any custom-cards in my Lovelace and very few enhancements that are not standard integrations; I do not use HACS.
I will admit that the system is very large:
| Language | files | blank | comment | code |
|---|---|---|---|---|
| YAML | 478 | 3284 | 3549 | 48590 |
| Python | 32 | 1175 | 796 | 7320 |
| Bourne Shell | 55 | 552 | 287 | 2714 |
| JSON | 20 | 1 | 0 | 2396 |
| Markdown | 12 | 529 | 0 | 1690 |
| make | 3 | 186 | 81 | 1254 |
| Jupyter Notebook | 1 | 0 | 1020 | 927 |
| HTML | 1 | 19 | 1 | 89 |
| -------- | -------- | -------- | -------- | -------- |
| SUM: | 602 | 5746 | 5734 | 64980 |
HMU directly on FB; @dcmsjc
Can you tell me how many states you have? {{ states | count }} in developer tools > template. It looks like it's spending a substantial amount of time trying to handle responses related to states.
The smallest system has 3602 states; the largest has 17701 states {{ states|count }}
Does this reproduce when connected to just the small one? That is a lot of states -- but it shouldn't be such a large amount that the app struggles; it's possible it's inefficient at handling updates, though, and that causes cascading slowdowns/issues.
I connected the macOS app to the two smaller systems (3602, 4581) states. There does not appear to be a problem; 100 MB RSS; 500 MB total; does not appear to be climbing
This server (https://d3500kn55any1uaby0fqp8i3hkt6w1fe.ui.nabu.casa) has 10K states; it triggers the cascading failure that is indicated by uncontrolled memory growth. FWIW, I am performing the same tests on iOS (15.2).
Here is sample when accessing site with 10K states: https://www.toptal.com/developers/hastebin/arofigufip.yaml
Lets continue the discussion here: https://github.com/home-assistant/iOS/issues/2101 I'll close this one as duplicate