frontend
 frontend copied to clipboard
Statistics Graph card: time span differs for "5 minute" & "hour"
Checklist
- [X] I have updated to the latest available Home Assistant version.
- [X] I have cleared the cache of my browser.
- [X] I have tried a different browser to see if it is related to my browser.
Describe the issue you are experiencing
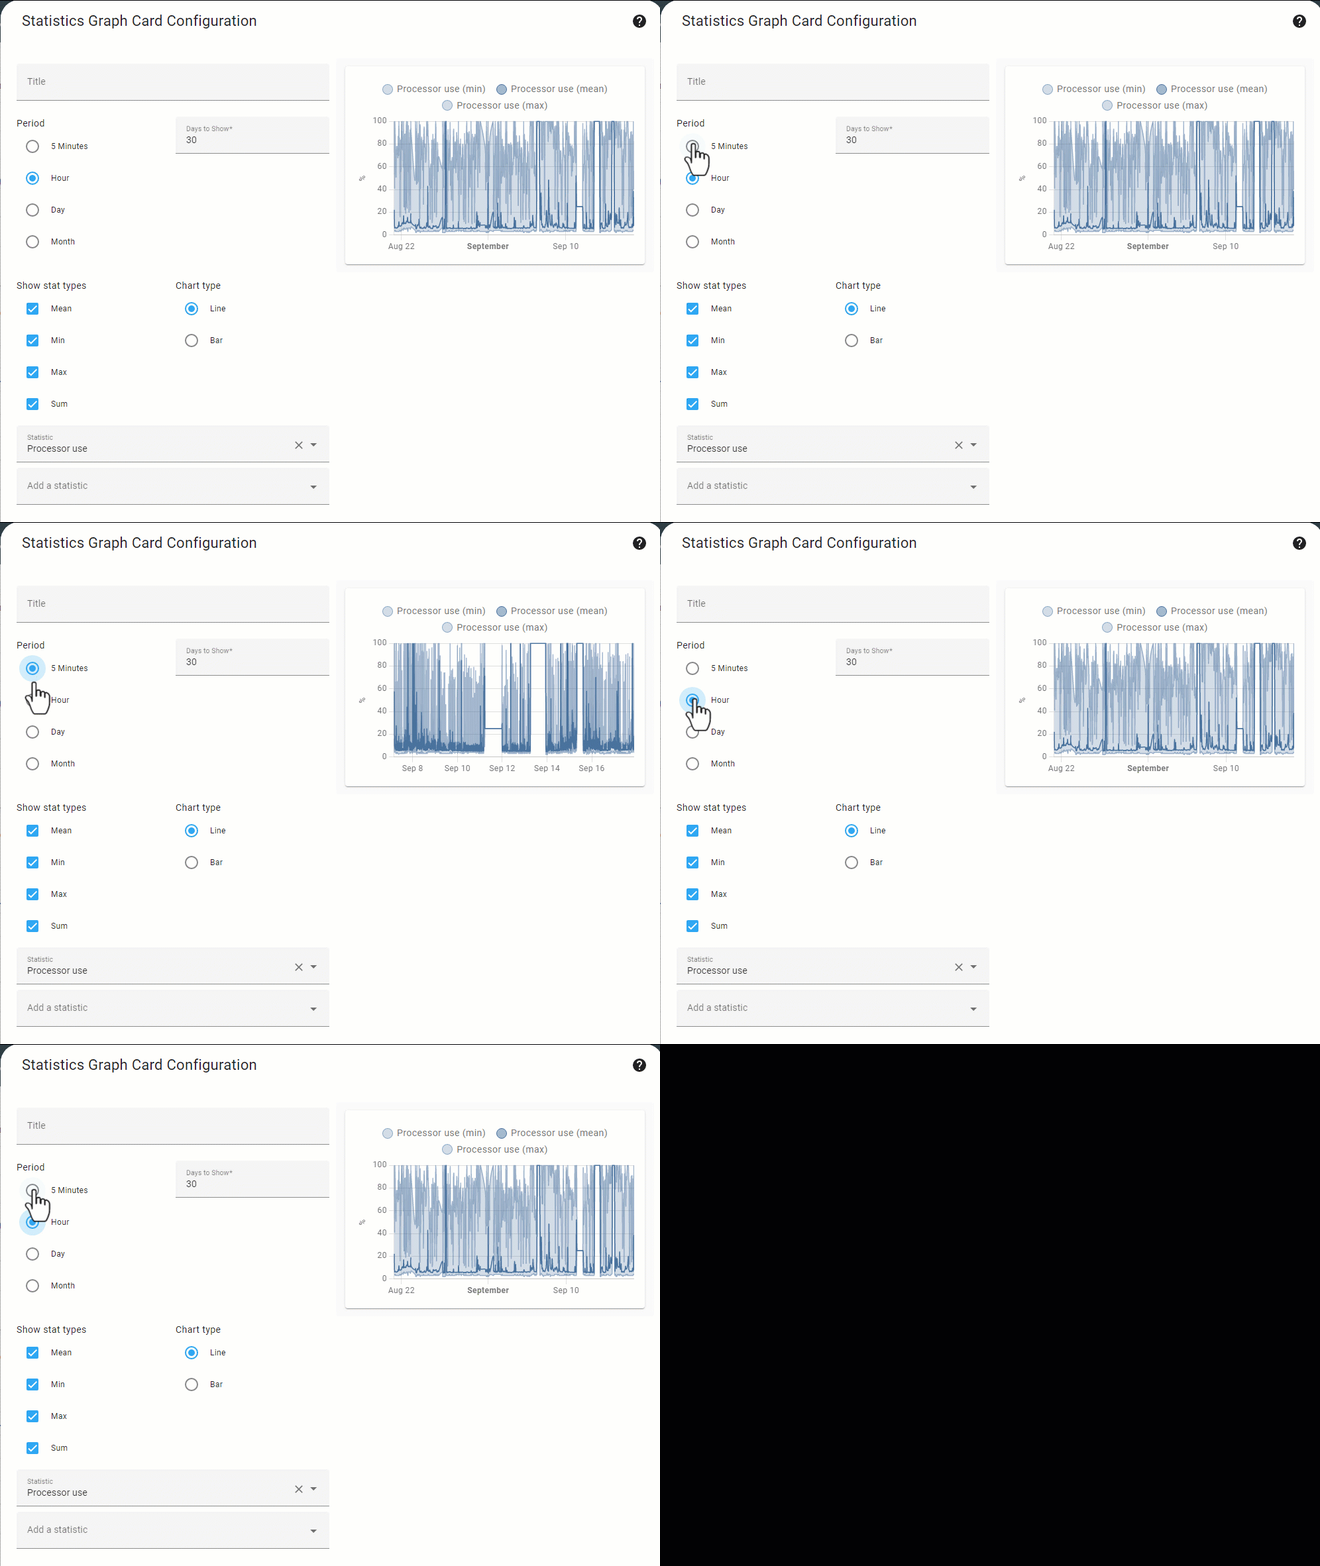
Create a new card, select "sensor.processor_use" entity (System monitor integration). After some time (a month in my case) open the card again and change the "period" option:

I realized this issue accidentally. First I created a card for with "5minutes" option; recently I realized that time span became about 10 days...
Describe the behavior you expected
Time span does not depend on the "period" option.
Steps to reproduce the issue
Described above
What version of Home Assistant Core has the issue?
2022.9.4
What was the last working version of Home Assistant Core?
No response
In which browser are you experiencing the issue with?
Chrome 105.0.5195.127
Which operating system are you using to run this browser?
No response
State of relevant entities
No response
Problem-relevant frontend configuration
No response
Javascript errors shown in your browser console/inspector
No response
Additional information
No response