frontend
 frontend copied to clipboard
Numeric label missing on Gauge card
Checklist
- [X] I have updated to the latest available Home Assistant version.
- [X] I have cleared the cache of my browser.
- [X] I have tried a different browser to see if it is related to my browser.
Describe the issue you are experiencing
See this screenshot
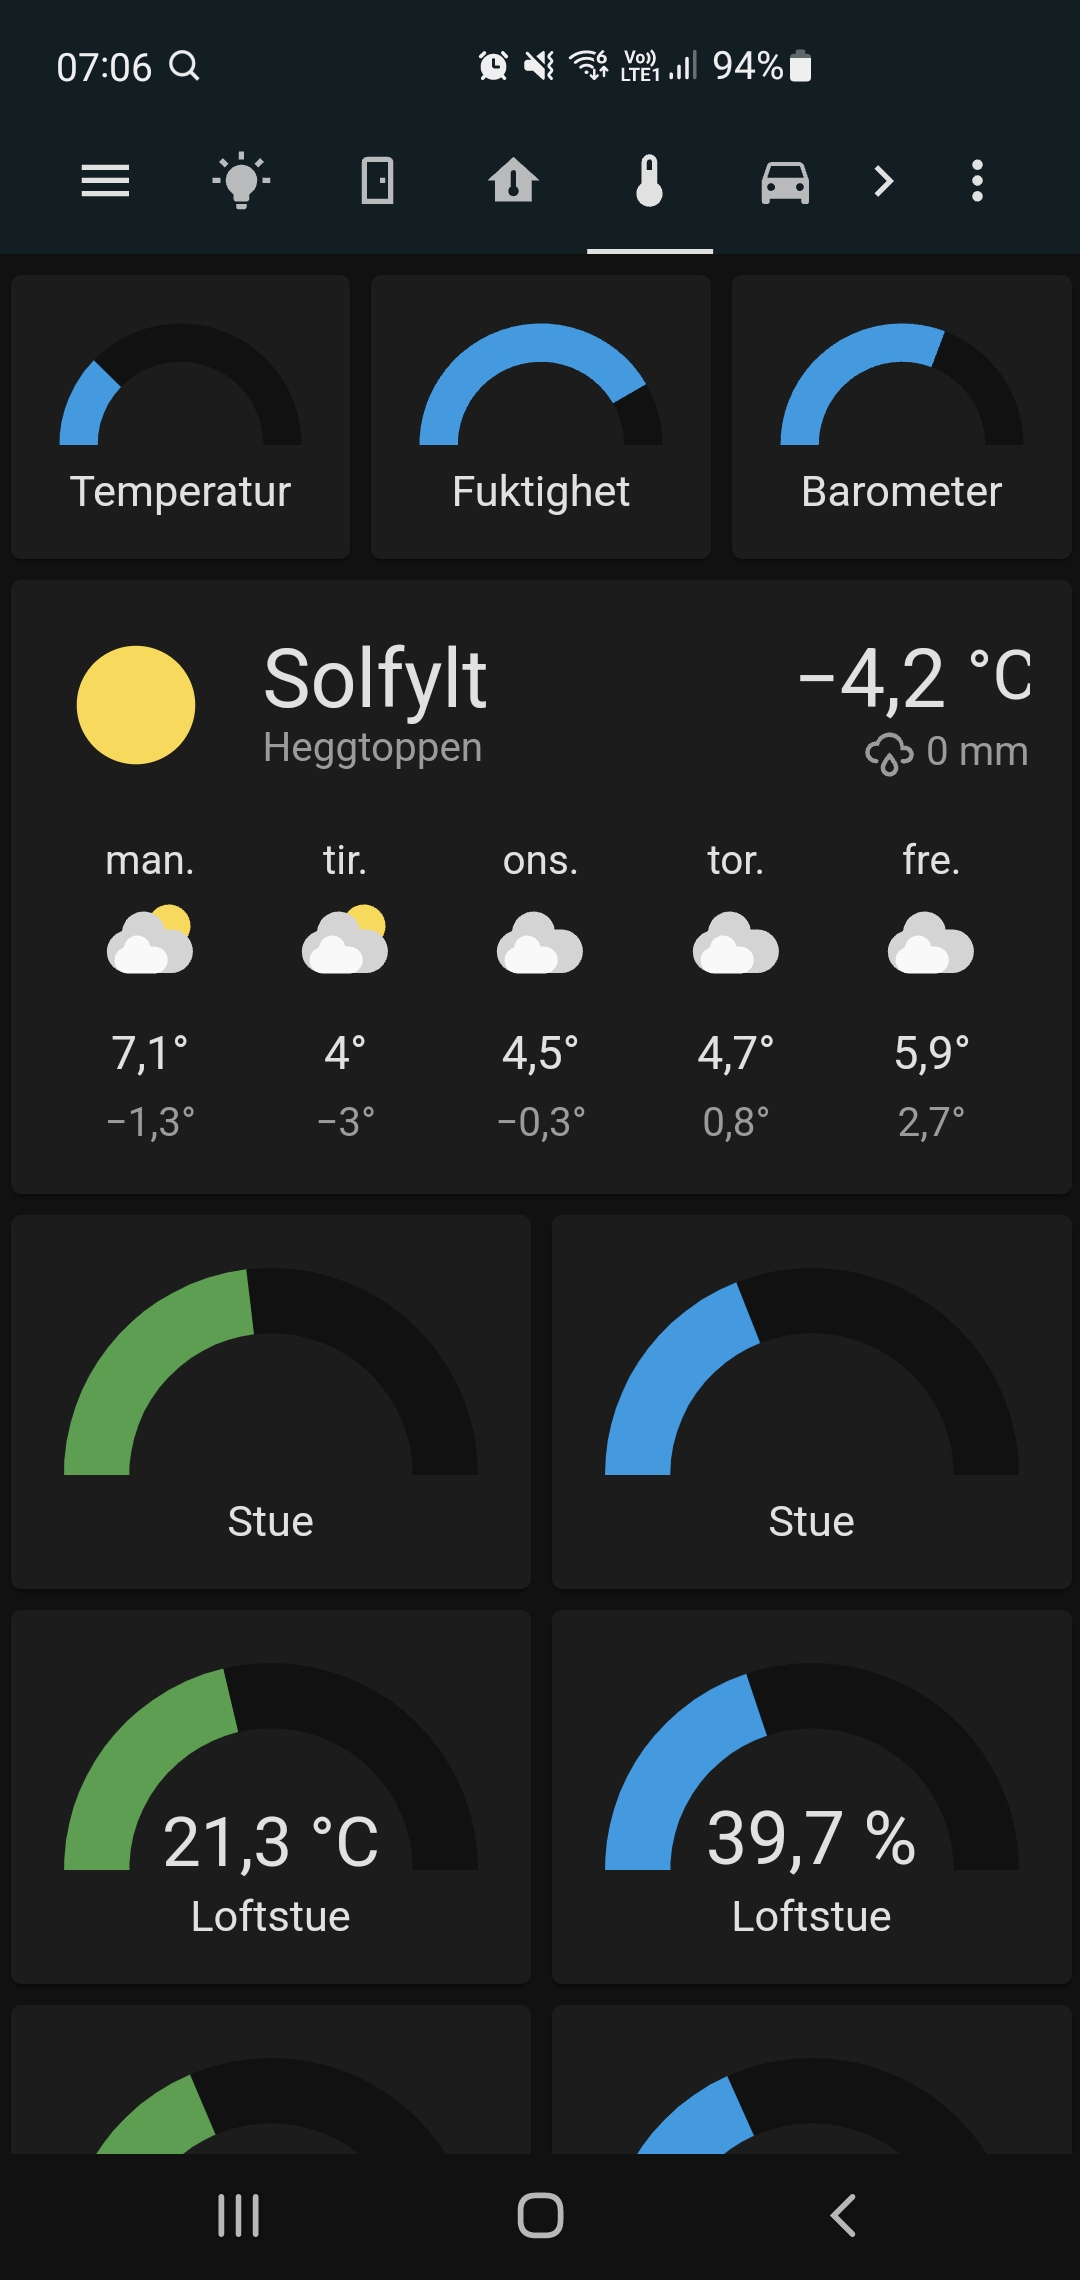
I have issues with the data is not loaded consistanly, both for browser view and in app. It load data about 80% of the time, if i refresh the data load correctly.
Describe the behavior you expected
Load data
Steps to reproduce the issue
...
What version of Home Assistant Core has the issue?
2022 +
What was the last working version of Home Assistant Core?
no idea, this has been a problem for atlest a year
In which browser are you experiencing the issue with?
No response
Which operating system are you using to run this browser?
windows, linux, android and ios
State of relevant entities
No response
Problem-relevant frontend configuration
No response
Javascript errors shown in your browser console/inspector
No response
Additional information
No response
With missing data you mean the state value in the gauge cards (temperature and percentage in your screenshot)? Is that the only UI element where this happens? Any errors in the browser console?
Yes the data is missing in the card on 20% of the page loadings, yes this is the only place it happens, no errormessage or anything. It happens on all browsers and the app for android and ios.
But it only happens on this two lines, the page has more gauges further down and it never happens on those.
There hasn't been any activity on this issue recently. Due to the high number of incoming GitHub notifications, we have to clean some of the old issues, as many of them have already been resolved with the latest updates. Please make sure to update to the latest Home Assistant version and check if that solves the issue. Let us know if that works for you by adding a comment 👍 This issue has now been marked as stale and will be closed if no further activity occurs. Thank you for your contributions.
There hasn't been any activity on this issue recently. Due to the high number of incoming GitHub notifications, we have to clean some of the old issues, as many of them have already been resolved with the latest updates. Please make sure to update to the latest Home Assistant version and check if that solves the issue. Let us know if that works for you by adding a comment 👍 This issue has now been marked as stale and will be closed if no further activity occurs. Thank you for your contributions.
There hasn't been any activity on this issue recently. Due to the high number of incoming GitHub notifications, we have to clean some of the old issues, as many of them have already been resolved with the latest updates. Please make sure to update to the latest Home Assistant version and check if that solves the issue. Let us know if that works for you by adding a comment 👍 This issue has now been marked as stale and will be closed if no further activity occurs. Thank you for your contributions.
Can confirm this bug for 2025.2.0b6: It will not show the numbers below the gauges, but the gauges itself show the data correctly, as it seems.
The numbers will appear as soon as an updated value is pushed to the UI, that's why two values are visible here in the screenshot - after loading the page didn't showed them and then they appeared.
This also never happens if you do a fresh start of the UI, it's more an issue if you tab back to the app / browser tab after it's been idle and then switch to a different view in the UI, and it's kinda rare to happen. Maybe 1-2% of the time. But it's been consistently an issue as far as I remember with Firefox, Chrome and the Android app.
I can (and unfortunately do) reproduce this behavior consistently on the Android app and on Chrome on my desktop PC.
Below is a part of a dashboard that is causing the issue. I removed 2 cards from the grid that increase/decrease volume to keep things readible. The one that is causing the issue is the gauge that is showing the current volume. The entire grid is not visible by default, but only turns visible when 'sensor.remote_current_app_active' turns 'True'. Everytime that happens (even if the current app sensor just turns off and on briefly) the numeric value is missing.
What helps in getting the numeric value to show:
- On the browser: refresh or change volume
- On the Android app: move away from the dashboard and come back, or change volume
- Changing volume
When I do either of these things, it has no impact on the other. So getting the value visible on the browser doesn't change a thing for the app. The sensor.receiver_volume is never Unknown or Unavailable and looking at the developer tools it also really shows a value. For completeness sake I'll also post the yaml of the sensor below.
What does NOT help in getting the numeric value to show:
- Updating the entities of my receiver or the receiver volume sensor
- Waiting
Dashboard YAML:
square: false
type: grid
cards:
  - square: true
    type: grid
    columns: 3
    cards:
      - type: gauge
        entity: sensor.receiver_volume
        needle: false
        min: 0
        max: 100
        tap_action:
          action: perform-action
          perform_action: script.mute_unmute_receiver_volume
          target: {}
        hold_action:
          action: perform-action
          perform_action: media_player.volume_set
          target:
            entity_id: media_player.denon_avr_x2800h
          data:
            volume_level: 0.5
        name: Mute / Unmute
        severity:
          green: 40
          yellow: 60
          red: 70
columns: 1
visibility:
  - condition: state
    entity: sensor.remote_current_app_active
    state: "True"
Sensor YAML:
{% if states('media_player.denon_avr_x2800h') == 'off' %}
0
{% elif is_state_attr('media_player.denon_avr_x2800h', 'is_volume_muted', True) %}
0
{% elif state_attr('media_player.denon_avr_x2800h', 'volume_level') is number and state_attr('media_player.denon_avr_x2800h', 'volume_level') > 0 %}
{{(state_attr('media_player.denon_avr_x2800h', 'volume_level')*100)|int}}
{% else %}
0
{% endif %}
Versions: Core: 2025.1.4 Frontend: 20250109.2 Desktop browser Chrome: 132.0.6834.160 Phone: Pixel 8 Pro with the latest version of all apps
I'll try to simplify the issue later, my guess is that it only takes a gauge that isn't visible by default.
Changing volume is the weirdest workaround I've ever heard 😂
Next time it's happening I'll try that.
Noo that's only in my case as my gauge is showing the volume. It's like you said: "The numbers will appear as soon as an updated value is pushed to the UI". Something I don't do frequently, as depending on my activity the volume is set to the correct value automatically and I hardly ever need to change it.
Ahhh! That makes sense. Guess I need a coffee.
Yeah, as soon as an update of the values are pushed, the text appears
I've seen this too a few times, the value is present in the HTML, but I see the viewBox attribute is set to 0 0 0 0 in cases where it failed.
I guess something goes wrong with rescaleSvg, but I've never been able to observe in a development environment, so it's a bit hard to pin down. Maybe some kind of race condition.
  private _rescaleSvg() {
    // Set the viewbox of the SVG containing the value to perfectly
    // fit the text
    // That way it will auto-scale correctly
    const svgRoot = this.shadowRoot!.querySelector(".text")!;
    const box = svgRoot.querySelector("text")!.getBBox()!;
    svgRoot.setAttribute(
      "viewBox",
      `${box.x} ${box!.y} ${box.width} ${box.height}`
    );
  }
@karwosts thanks for the confirmation.
I think the bug is somehow related to some sleep function in the browser(s). Meaning that the tab/app is in the background for a while, as the last update came in.
So some kind of deferred painting event as the tab/app comes back in focus is not done (or it is done, but the attribute for the text is empty) so the text remains empty.
I've never observed it while a tab/the app remained in focus, even for a long time.
Hope that helps to narrow it down? 🤔
@raqua well, this could actually be the same bug. The issue here is the deferred painting of the webpage. Meaning the webpage is not painted until every style sheet element is loaded. If the gauge gets its last update before this moment, the page won't be visible, while the gauge update happened.
I'm not that deep into webpage development, but I think what's missing is that there's a listener for the event "visibilitychange" which will run _rescaleSvg() (in src/components/ha-gauge.ts), after a check if the document is hidden.
There hasn't been any activity on this issue recently. Due to the high number of incoming GitHub notifications, we have to clean some of the old issues, as many of them have already been resolved with the latest updates. Please make sure to update to the latest Home Assistant version and check if that solves the issue. Let us know if that works for you by adding a comment 👍 This issue has now been marked as stale and will be closed if no further activity occurs. Thank you for your contributions.
This problem appeared for me with the 2025.6.0 release.
Currently at: this version: Installation method Home Assistant OS Core 2025.6.1 Supervisor 2025.05.5 Operating System 15.2 Frontend 20250531.3
Hardware is a Intel x86, Intel(R) Core(TM) i5-3570 CPU @ 3.40GHz, running Linux version 6.12.23-haos
I have tried both Firefox and Edge, both shows the same problem.
In the Firefox developer tool I do get some errors that could be related to this: Received event for unknown subscription 50. Unsubscribing. [connection.js:26:36] The number 50 could be any "random" number, so this could be a race condition occurring when the page have a lot of elements displayed.
There hasn't been any activity on this issue recently. Due to the high number of incoming GitHub notifications, we have to clean some of the old issues, as many of them have already been resolved with the latest updates. Please make sure to update to the latest Home Assistant version and check if that solves the issue. Let us know if that works for you by adding a comment 👍 This issue has now been marked as stale and will be closed if no further activity occurs. Thank you for your contributions.