recorder or sqlalchemy query malfunction?
The problem
cc: @bdraco because after #72991 it seems to me this is another recorder related issue
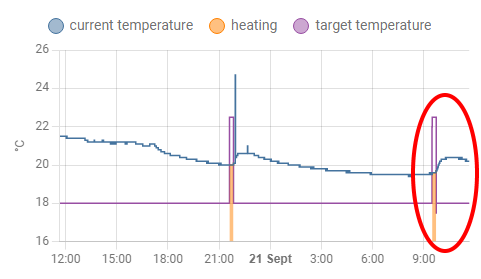
TLDR: history graph "flatlines"
This is at least a 2 year old problem:
- related issues:
- https://github.com/home-assistant/frontend/issues/5129
- https://github.com/home-assistant/frontend/issues/7133
- https://github.com/home-assistant/frontend/issues/6520
- https://github.com/home-assistant/frontend/issues/6135
- it appears "randomly", independent of OS/core/add-on/browser/app/anything versions
- impossible to get rid of it (it survives even OS reboots)
- then magically disappears after a core update
Currently I'm able to make a graph fail/work intentionally:
- if I add another entity to the graph, it starts working
- when I remove the additional entity, it fails again
- if I edit other, independent parts of the UI, it has no effect
- I noticed it after updating to core 2022.9.5 on one of my systems (but another system, identical rPi3, OS, core, etc. versions, but different entities/UI shows no problem)
Proof:
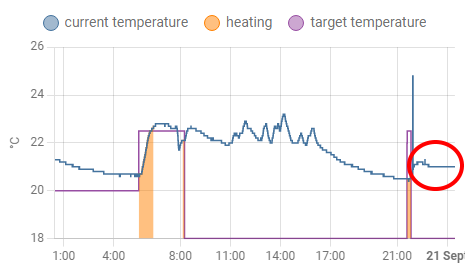
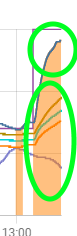
When I add a secondary entity (an average sensor) to the original graph (a generic thermostat), it starts working properly:
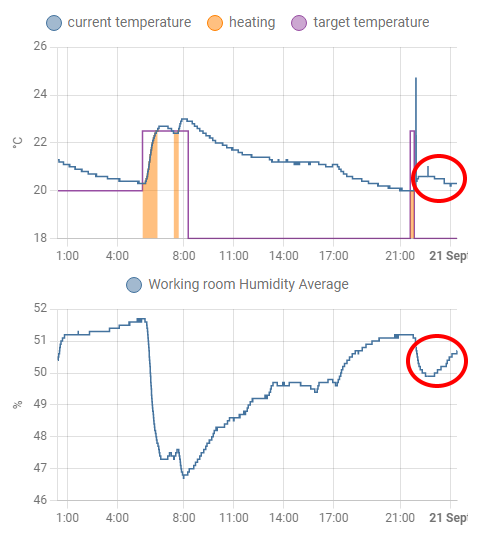
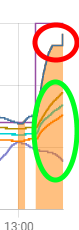
Though the unedited graphs are still failing:
After refresh, the failing graph shows the proper value:
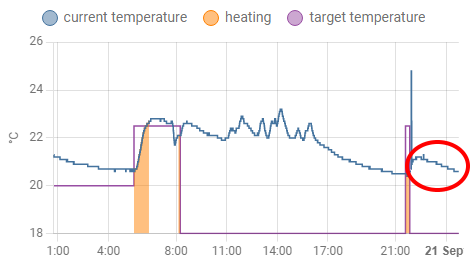
After removing the secondary entity from a graph, it fails again (theoretically, the UI is binary identical with the previous unedited version):
After refresh, it works:
What version of Home Assistant Core has the issue?
2022.9.5
What was the last working version of Home Assistant Core?
No response
What type of installation are you running?
Home Assistant OS
Integration causing the issue
recorder
Link to integration documentation on our website
No response
Diagnostics information
No response
Example YAML snippet
No response
Anything in the logs that might be useful for us?
No response
Additional information
Home Assistant 2022.9.5 Supervisor 2022.09.1 Operating System 9.0 Frontend 20220907.2 - latest
rPI 3 (32 bit)
If I am understanding this correctly, the data seems right after a refresh.
This actually seems like a frontend issue and not a backend one.
I very often - at least 1 time a week - observe a case: -- all history-graphs for sensors with UoM are flatlined; -- same is for custom:mini-graph-card; -- all history-graphs for sensors w/o UoM are not changing; -- refreshing a browser does not help; -- sensor's values are actually being updated (seen on Entities card, for instance); -- rebooting HA helps.
Already wrote about it here: https://github.com/home-assistant/core/issues/73154
We probably need to convert history to do streaming instead of polling as there is an alignment issue with data and the commit interval.
That's effectively the same project we did for logbook but larger so it needs about a month worth of development bandwidth
I very often - at least 1 time a week - observe a case: -- all history-graphs for sensors with UoM are flatlined; -- rebooting HA helps.
In my case this is quite different: rebooting HA does not help. Even after OS reboots and 2 core updates (2022.9.6, 2022.9.7) my thermostat graphs flatline, all of them, constantly, I simply can't get rid of this situation. I refresh the browser, wait, then it 100% flatlined. In case of the Android app, I have to restart it before every use.
It is strange for me, how can a timing issue be so permanent?
Though something is similar: all history graphs with thermostats are flatlined, no other entities (so in case of some type of entity, the graphs tend to flatline), though when I add another entity to the graph, it works, until I remove it.
Hey there @home-assistant/core, mind taking a look at this issue as it has been labeled with an integration (recorder) you are listed as a code owner for? Thanks!
(message by CodeOwnersMention)
recorder documentation recorder source (message by IssueLinks)
Have the same issue fwiw with my thermostat graphs. I have an iPad with some Tado graphs that I need to refresh manually (by pulling down the screen) every time I want the latest data. The graph does scroll in time by itself, but it just doesn't show updated sensor data anymore.
All related issues (mentioned in the OP) seem to get closed eventually without a fix. Hope someone can look into this, seems pretty easy to reproduce.
Same here, my history graph for a generic thermostat elment produces this error most of the time, but not always.
I'm running a pretty recent install of Ha in docker with mariaDB. HA version is 2022.11.3 Frontend is on 20221108.0 - latest
Multiple people wrote, that "fails, but not always".
I suppose the "flatline" disappears, when the app/UI wasn't used for a longer time and it refreshes the whole screen. In this case, my system works also.
But without this implicit (or manual) refresh, the error is permanent in my case, even after 2 months, multiple OS and core updates, editing the config multiple times, restarting the system uncountable times, power failures: my thermostat graphs never ever work correctly on one of my systems, and always work correctly on the other system (same versions, same add-ons, same HW, certainly different config).
Sorry, I did not express myself correctly. I experience the same as @lmagyar, the climate history graphs (both for a generic thermostat and for two gree ACs) will always break, but the time it takes to break is undeterministic.
It always needs a page refresh/app restart to work again.
Its possible there are multiple issues going on here, but we need to fix the lack of synchronization with the database when fetching history.
Right now none of the code accounts for the time it takes to commit the data and it assumes queries will always have the data written in time. Once that assumption fails, every query after it is wrong.
https://github.com/home-assistant/core/issues/78875#issuecomment-1254053411
Hi! I am experiencing the same issue with my thermostat graphs.
I'm experiencing this in:
- the Android app (2022.10.2-full);
- the web app on Firefox 107.0.
I'm running on a Pi4 with:
- HA 2022.11.4
- Supervisor 2022.10.2
- OS 9.3
- UI 20221108.0
I have to refresh the web app, and kill and start again the android app to see my updated graphs.
https://github.com/home-assistant/core/issues/78875#issuecomment-1259514559
I can confirm, adding a calculated value to the climate graph (e.g. indoor mean temperature) fixes it.
The issue persists in 2022.11.4.
Today my second system is also got "flatlined".
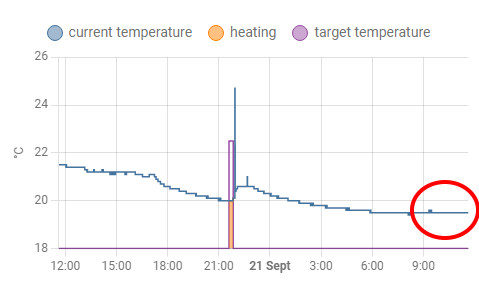
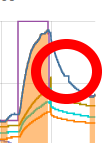
Though the issue is getting worse:
- now even a "mixed" chart (thermostat and plain temperature values on the same chart) got flatlined
- only the thermostat is flat, the plain temperatures are not flatlined
- the flatline can "jump", I've never ever seen this behaviour
After refresh:
Does this problem go away with the live history in 2023.2.x?
It looks like it does. Installed 2023.2 last weekend and my graphs that suffered from this issue are all complete as we speak. I'll keep an eye on it.
Thanks for confirming. I'll close this one out as the misalignment is no longer possible since cached-history has been completely removed in 2023.2.x and replaced with live history.
I confirm also, it nearly got perfect. :) Tested on: Android app, Win Chrome.
Only strange behavior: when I go back to the Android app after a few hours, I see it shows a flatlined chart, but refreshes the whole graph completely within a second, so the final result is OK.
Only strange behavior: when I go back to the Android app after a few hours, I see it shows a flatlined chart, but refreshes the whole graph completely within a second, so the final result is OK.
That's likely the app sleeping and than waking back up and refreshing the page and you see the page before it went to sleep. Can likely be avoided with a faster device but probably not an issue.