pn.save('???.html', embed=True) not working properly with several holo object.
ALL software version info
xarray==0.16.2 panel==0.10.2 holoviews==1.14.0
Description of expected behavior and the observed behavior
Panel object creating from several holoobject is working fine in jupyterlab and jupyter notebook but the html file exported is not working (I used embed=True).
Complete, minimal, self-contained example code that reproduces the issue
import xarray as xr
import hvplot.xarray  # noqa

import holoviews as hv
from holoviews import opts
hv.extension('bokeh')

import panel as pn
import panel.widgets as pnw
pn.extension()

# Load tutorial xarray air dataset
air_ds = xr.tutorial.open_dataset('air_temperature').load()

# Create two different datasets based on the yearly mean and standard deviation of the  air temperature
meanairbyyear = air_ds.air.groupby('time.year').mean()
stdairbyyear = air_ds.air.groupby('time.year').std()
meanair2d = xr.Dataset(
    {
        "2013": (["lat", "lon"], meanairbyyear[0,:,:]),
        "2014": (["lat", "lon"], meanairbyyear[1,:,:]),
    },
    coords={
        "lon": ("lon", meanairbyyear.lon),
        "lat": ("lat", meanairbyyear.lat),
    },
)
stdair2d = xr.Dataset(
    {
        "2013": (["lat", "lon"], stdairbyyear[0,:,:]),
        "2014": (["lat", "lon"], stdairbyyear[1,:,:]),
    },
    coords={
        "lon": ("lon", stdairbyyear.lon),
        "lat": ("lat", stdairbyyear.lat),
    },
)

# Define panel object
variable_type = ('2013', '2014')

variables  = pnw.RadioButtonGroup(name='Variable', value='2014',
                                 options=list(variable_type))

def plot_map_mean(var):
    return meanair2d[var].hvplot.contourf(width=400)

def plot_map_std(var):
    return stdair2d[var].hvplot.contourf(width=400)


@pn.depends(variables)
def reactive_mean_plot(variables):
    return plot_map_mean(variables)

@pn.depends(variables)
def reactive_std_plot(variables):
    return plot_map_std(variables)

widgets   = pn.Column("<br>\n# Years", variables)
contour_pn = pn.Column(widgets,pn.Column(reactive_mean_plot,
                                         reactive_std_plot)
                      )
contour_pn
The contour_pn panel object works fine in my jupyterlab notebook. However when I save it as html, the object is not responding.
I used the command below to export it:
contour_pn.save('test_panel.html', embed=True)
If I save only one of the holo object with the widget, it is not working either:
pn.Column(widgets,reactive_mean_plot).save('test_panel_onlymean.html', embed=True)
You can download the html file here: https://dl.dropbox.com/s/lo4kmugwxl8g3vs/test_panel.html?dl=0
https://dl.dropbox.com/s/6t50hx6ky3paxt8/test_panel_onlymean.html?dl=0
What if you tried:
def plot_map_mean(var):
    return meanair2d[var].hvplot.contourf(width=400, dynamic=False)

def plot_map_std(var):
    return stdair2d[var].hvplot.contourf(width=400, dynamic=False)
Thank you @ahuang11 , I just tried but it doesn't change the output. I opened the html in both Firefox and Chrome.
Hi there, I have been checking this and seems to me that this is kind of related with https://github.com/holoviz/panel/issues/1222. If I structure/update the example code as something like:
import xarray as xr
import hvplot.xarray # noqa
import holoviews as hv
from holoviews import opts
hv.extension('bokeh')
import panel as pn
import panel.widgets as pnw
pn.extension()
# Load tutorial xarray air dataset
air_ds = xr.tutorial.open_dataset('air_temperature').load()
# Create two different datasets based on the yearly mean and standard deviation of the air temperature
meanairbyyear = air_ds.air.groupby('time.year').mean()
stdairbyyear = air_ds.air.groupby('time.year').std()
meanair2d = xr.Dataset(
{
"2013": (["lat", "lon"], meanairbyyear[0,:,:].data),
"2014": (["lat", "lon"], meanairbyyear[1,:,:].data),
},
coords={
"lon": ("lon", meanairbyyear.lon.data),
"lat": ("lat", meanairbyyear.lat.data),
},
)
stdair2d = xr.Dataset(
{
"2013": (["lat", "lon"], stdairbyyear[0,:,:].data),
"2014": (["lat", "lon"], stdairbyyear[1,:,:].data),
},
coords={
"lon": ("lon", stdairbyyear.lon.data),
"lat": ("lat", stdairbyyear.lat.data),
},
)
# Define panel object
variable_type = ('2013', '2014')
variables = pnw.RadioButtonGroup(
name='Variables', value='2014',
options=list(variable_type)
)
@pn.depends(variables)
def reactive_plot(variables):
return pn.Column(
meanair2d[variables].hvplot.contourf(width=400),
stdair2d[variables].hvplot.contourf(width=400),
)
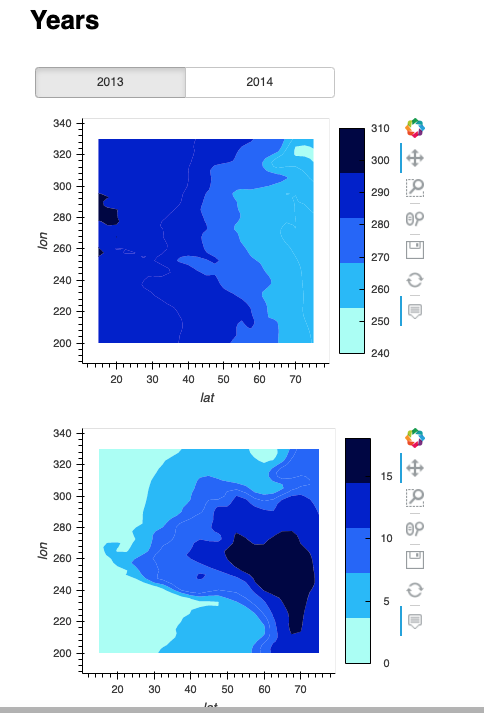
contour_pn = pn.Column("<br>\n<h1> Years</h1>", variables, reactive_plot)
contour_pn.save('test_panel.html', embed=True)
And patch the panel.io.embed logic as described over https://github.com/holoviz/panel/issues/1222#issuecomment-652610834
I'm able to switch the year in the generated .html: