hvplot
 hvplot copied to clipboard
A high-level plotting API for pandas, dask, xarray, and networkx built on HoloViews

I think interactive is really cool, but starting out the release notes with "This is a minor release" really downplays it and people might not be interested in checking it...
As far as I can tell, the Pandas .plot() API does not have a way to [change the background color](https://stackoverflow.com/questions/23123272/change-pandas-plot-background-color) without dropping down to matplotlib. hvPlot appears to inherit this...
The promise of `hvplot`'s `.interactive` API is that you can use the same API as pandas/xarray with widgets and so on. It would be useful if `.interactive` could be used...
I'm using `ds.hvplot.quadmesh` to project and visualise a heatmap of geospatial data. Due to the size of the data, I have to set `rasterize=True`. As far as I'm aware (and...
#548 should have closed this issue, but I still have problems. If I run the code in issue #327: ```python import numpy as np import pandas as pd import hvplot.pandas...
#### ALL software version info bokeh 2.3.0 holoviews 1.14.2 hvplot 0.7.1 #### Description of expected behavior and the observed behavior Hello, when setting default values for the legend position in...
#### Is your feature request related to a problem? Please describe. Adding tests against dependency libraries like xarray and pandas can preemptively catch issues like #563 (which came about due...
I love the convenience of `coastline=True` in hvplot. Would it be straightforward to add the rest of the very common feature types from: https://scitools.org.uk/cartopy/docs/latest/matplotlib/feature_interface.html#cartopy.feature ? 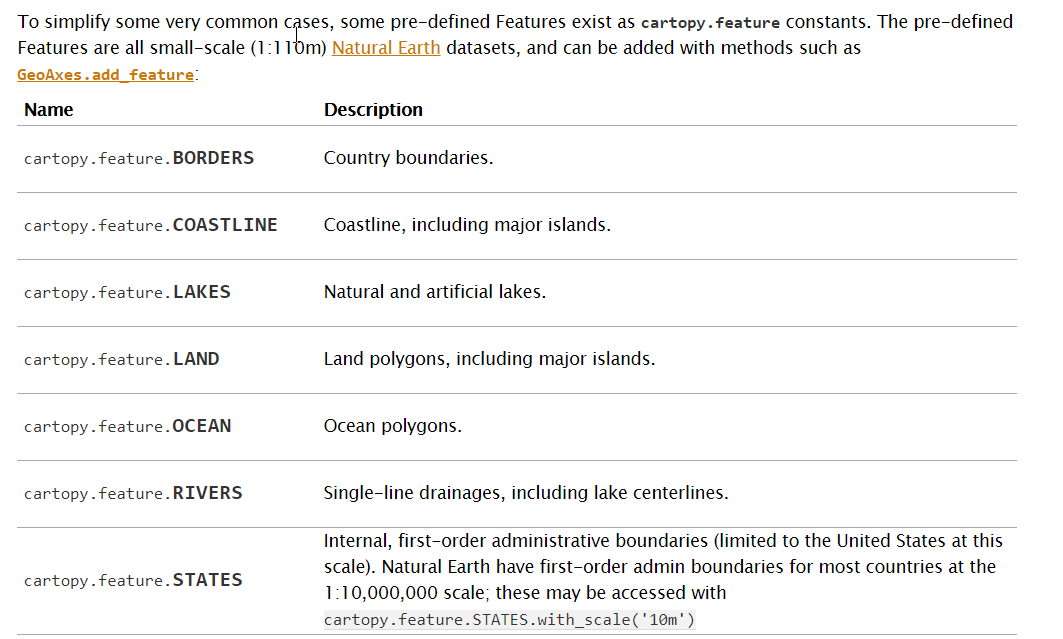
Hello, I often need to plot slightly different versions of my data depending on who’s requesting data from me. I was hoping for a simple way of transforming columns such...
#### Is your feature request related to a problem? Please describe. This issue was first raised here: https://discourse.holoviz.org/t/workaround-for-date-based-histogram-tick-labels/788 I have time series data, and would like to bin the data...