hvplot

hvplot copied to clipboard
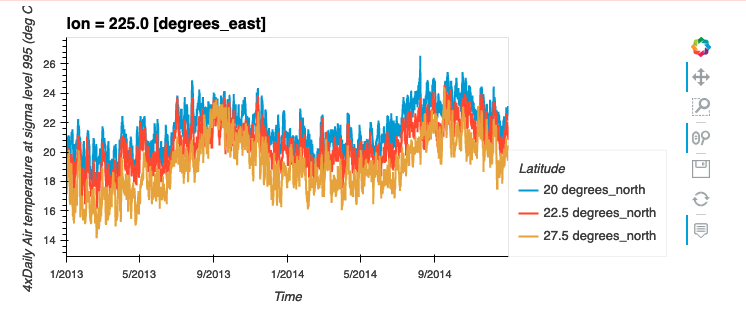
Display units in the legend title
xarray displays the units attr in bracket in the legend title while hvplot displays it on every legend entry.
import hvplot.xarray
import numpy as np
import pandas as pd
import matplotlib.pyplot as plt
import xarray as xr

airtemps = xr.tutorial.open_dataset("air_temperature")
air = airtemps.air - 273.15
air.attrs = airtemps.air.attrs
air.attrs["units"] = "deg C"
air.isel(lon=10, lat=[19, 21, 22]).plot.line(x="time")

air.isel(lon=10, lat=[19, 21, 22]).hvplot.line(by='lat'):