hvplot
 hvplot copied to clipboard
Enhancement to Geo tab in explorer
Fixes #783
After playing around with the geo tab for a bit, I found it non-intuitive that it mirrors hvplot by enabling geo=True based on project and features. This makes sense when coding, but when looking at the interface and clicking around, it is hard (at least for me) to find the logic. So now it is only one - the Geo.geo parameter, which can enable the other geographic parameters. When Geo.geo=False, the other parameters in the Geo class will be disabled in the explorer and will not be added to the plot through kwargs.
It now also has the option to remove tiles by choosing None. I was wondering if I should use a dictionary instead of a list and have the None option be empty or something like No tiles. But looking at the Operation tab, it seems to be accepted to use None.
After playing around with the geo tab for a bit, I found it non-intuitive that it mirrors hvplot by enabling
geo=Truebased onprojectandfeatures. This makes sense when coding, but when looking at the interface and clicking around, it is hard (at least for me) to find the logic. So now it is only one - theGeo.geoparameter, which can enable the other geographic parameters. WhenGeo.geo=False, the other parameters in theGeoclass will be disabled in the explorer and will not be added to the plot throughkwargs.
That sounds like a good idea to me!
It now also has the option to remove tiles by choosing None. I was wondering if I should use a dictionary instead of a list and have the None option be empty or something like
No tiles. But looking at the Operation tab, it seems to be accepted to use None.
Then I guess for now it's fine. FYI in Lumen the options include by default a string with one whitespace character to support the no/empty selection case: https://github.com/holoviz/lumen/blob/f92a7cba647187cde0ef7225a42ee735bccdff16/lumen/filters/base.py#L235-L237
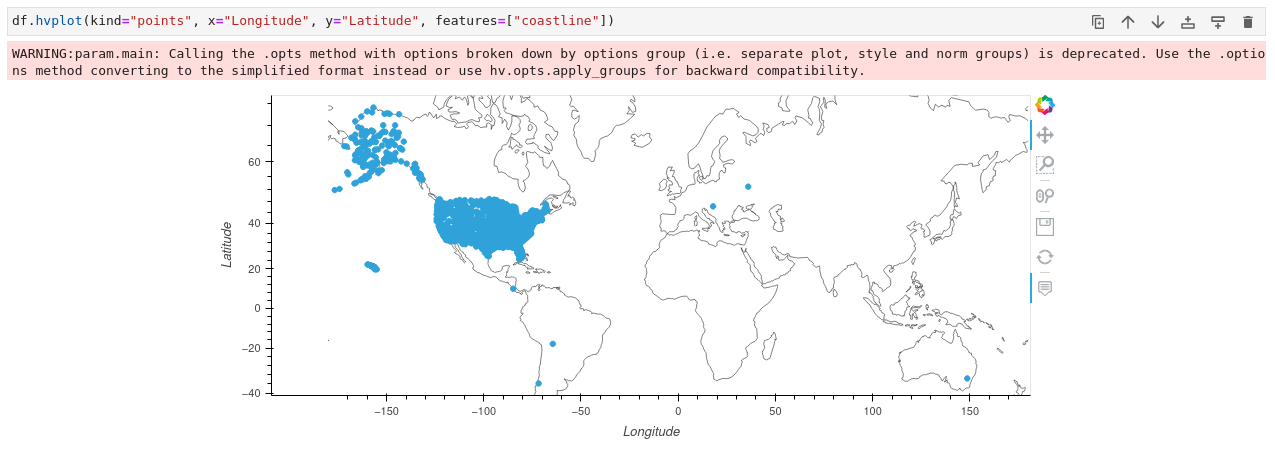
I don't know if it's related to changes in this PR, probably not but I haven't checked, but I can't get it to work as I would expect:

Not related to this PR - but it should work. When running the arguments you provided with a "clean" hvplot command, you get this warning:

This is because the kind should be Points to work:
So two things need to be addressed (as I see it):
- Be able to set the kind of a plot to
Points(and potential other geo kinds). Right now, there is no way to set the kind toPoints. - Deliver the warning information to Explorer.
I did notice a small bug I made in a previous PR, where the value of x and y should only be set if they are None. This means that I could not set x="Longitude"
After merging with main I can't get the following to work:
import hvplot.pandas
import hvplot.ui
from bokeh.sampledata.airport_routes import airports

hvplot.ui.hvPlotExplorer(airports, kind="points", x="Longitude", y="Latitude")
A git bisect shows this commit is the problem https://github.com/holoviz/hvplot/pull/799/commits/87b07b424067c4a413edbf4ab46360915c6a51e3 from #799 (which has a note about the removal of __new__.
Also, on main we have currently disabled geo features:
https://github.com/holoviz/hvplot/blob/30999e80164390711badb9d444c1a7be75f5ae11/hvplot/ui.py#L343
So I would suggest we postpone this PR to a future release. @maximlt what do you think?
To get the example to work I needed to do the following changes:
diff --git a/hvplot/ui.py b/hvplot/ui.py
index 09e76a4..e14868c 100644
--- a/hvplot/ui.py
+++ b/hvplot/ui.py
@@ -340,14 +340,13 @@ class hvPlotExplorer(Viewer):
     labels = param.ClassSelector(class_=Labels)

     # Hide the geo tab until it's better supported
-    # geo = param.ClassSelector(class_=Geo)
+    geo = param.ClassSelector(class_=Geo)

     operations = param.ClassSelector(class_=Operations)

     style = param.ClassSelector(class_=Style)

-    @classmethod
-    def from_data(cls, data, **params):
+    def __new__(cls, data, **params):
         if is_geodataframe(data):
             # cls = hvGeomExplorer
             raise TypeError('GeoDataFrame objects not yet supported.')
@@ -509,7 +508,7 @@ class hvPlotExplorer(Viewer):
                 }, show_name=False)),
                 ('Style', self.style),
                 ('Operations', self.operations),
-                # ('Geo', self.geo)
+                ('Geo', self.geo)
             ]
             if event and event.new not in ('area', 'kde', 'line', 'ohlc', 'rgb', 'step'):
                 tabs.insert(5, ('Colormapping', self.colormapping))
@@ -617,6 +616,9 @@ class hvGeomExplorer(hvPlotExplorer):
         pass


+    def __new__(cls, data, **params):
+        return super(hvPlotExplorer, cls).__new__(cls)
+
 class hvGridExplorer(hvPlotExplorer):

     kind = param.Selector(default=None, objects=sorted(GRIDDED_KINDS))
@@ -650,6 +652,8 @@ class hvGridExplorer(hvPlotExplorer):
         values = (self._data[y] for y in y)
         return max_range([(np.nanmin(vs), np.nanmax(vs)) for vs in values])

+    def __new__(cls, data, **params):
+        return super(hvPlotExplorer, cls).__new__(cls)

 class hvDataFrameExplorer(hvPlotExplorer):

@@ -704,3 +708,7 @@ class hvDataFrameExplorer(hvPlotExplorer):
         if not len(values):
             return (np.nan, np.nan)
         return max_range([(np.nanmin(vs), np.nanmax(vs)) for vs in values])
+
+
+    def __new__(cls, data, **params):
+        return super(hvPlotExplorer, cls).__new__(cls)