hvplot
 hvplot copied to clipboard
groupby hvplot: 'Column' object has no attribute 'opts' or 'layout'
Cannot save groupby hvplot to html file - both hvplot.save and renderer.save show attribute errors (i.e. hvplot.save shows no 'opts' and renderer.save shows no 'layout'). Cannot add options on the plot like a normal hvplot (i.e. cannot add ".opts()" to customize). I guess these issues could be due to similar reasons, and it is not the same as previous closed issues (cannot be solved by those solutions).
Note: When I have a normal hvplot plot (i.e. not having a groupby widget), hvplot.save works just fine. Similar errors received no matter using jupyter notebook or google colab.
ALL software version info
hvplot 0.7.3 holoviews 1.13.3 bokeh 2.1.1 python 3.7.8 jupyter notebook 6.1.4
Description of expected behavior and the observed behavior
Using hvplot.save or renderer.save should be able to save the hvplot to a html file that can be easily shared with others. However, I cannot save the plot successfully. I wonder how to fix this issue or any other possible ways to save the plot. Thank you in advance!!
Complete, minimal, self-contained example code that reproduces the issue
import pandas as pd
import numpy as np
import altair as alt
import hvplot.pandas
import holoviews as hv
hv.extension("bokeh")
I wanted to plot the stacked bar chart grouped by state and year.
chart = df.hvplot(
    kind='barh',
    stacked=True,
    x="Ylgb",
    xlabel="LGB Identity",
    y="percent",
    ylabel="Percent (%) by age group",
    by="Age",
    cmap=["gray", "orange", "gold", "#2ca02c", "blue","purple","royalblue", "#d62728"],
    groupby=["State","Year"],
    legend='top',
    widget_location='top',
    bar_width=0.42,
    width=800,
    height=220,
    #dynamic = False   # adding or removing this line does not affect the errors
)
The plot looks like this:

I have tried two ways to save the plot, as following.
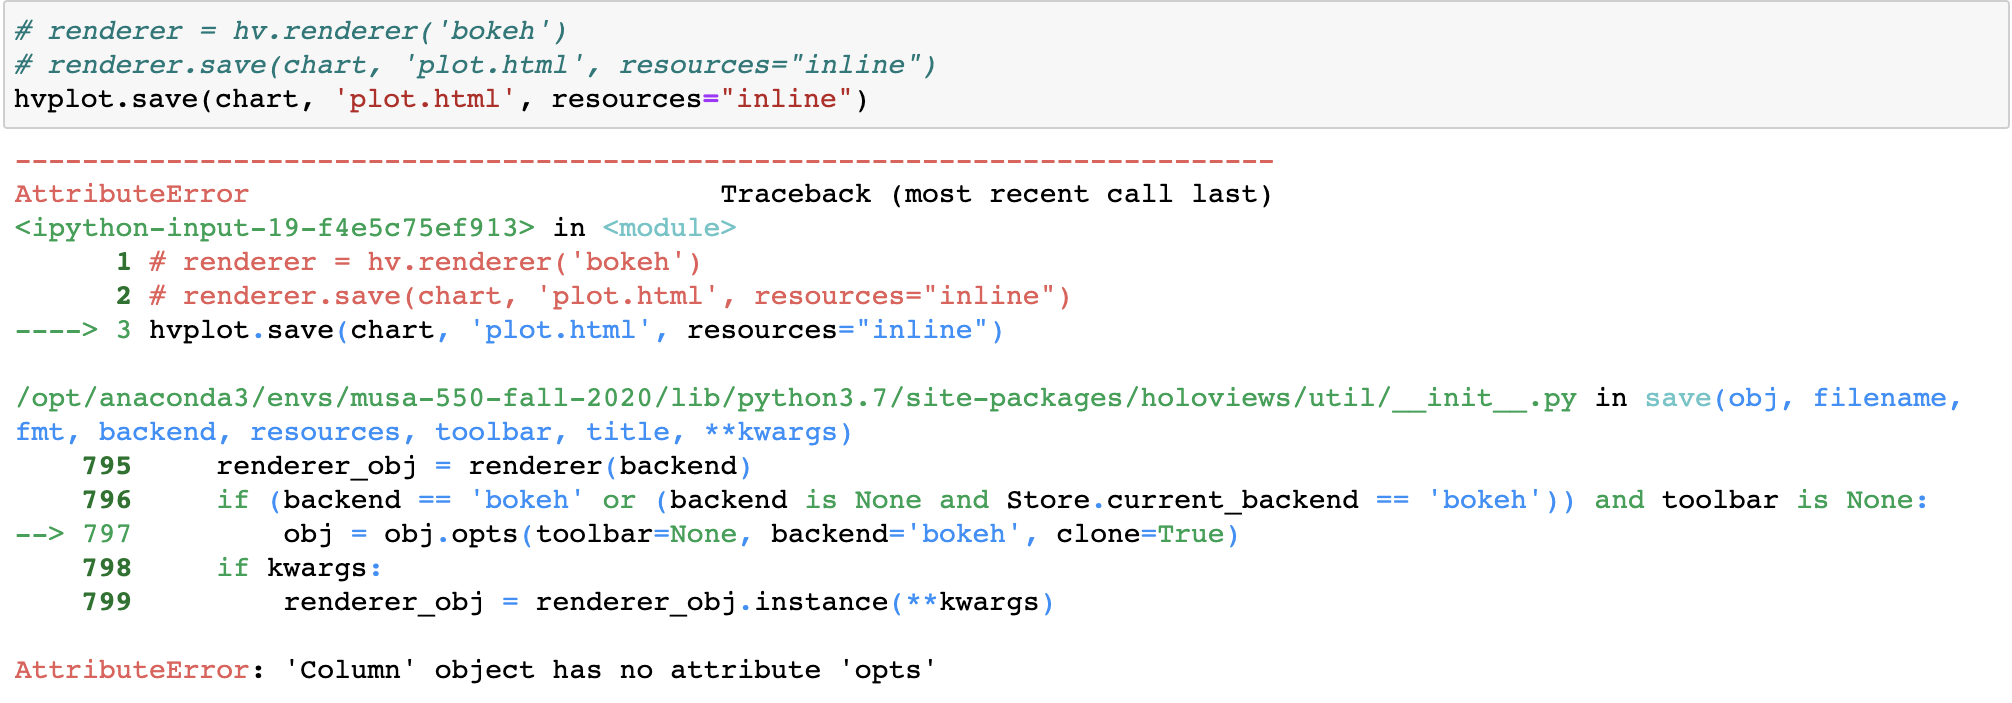
hvplot.save(chart, 'plot.html', resources="inline")   # adding or removing "resourcces='inline'" does not affect the errors

renderer = hv.renderer('bokeh')
renderer.save(chart, 'plot.html', resources="inline")  # adding or removing "resourcces='inline'" does not affect the errors
Screenshot error from hvplot.save
Screenshot error from renderer.save

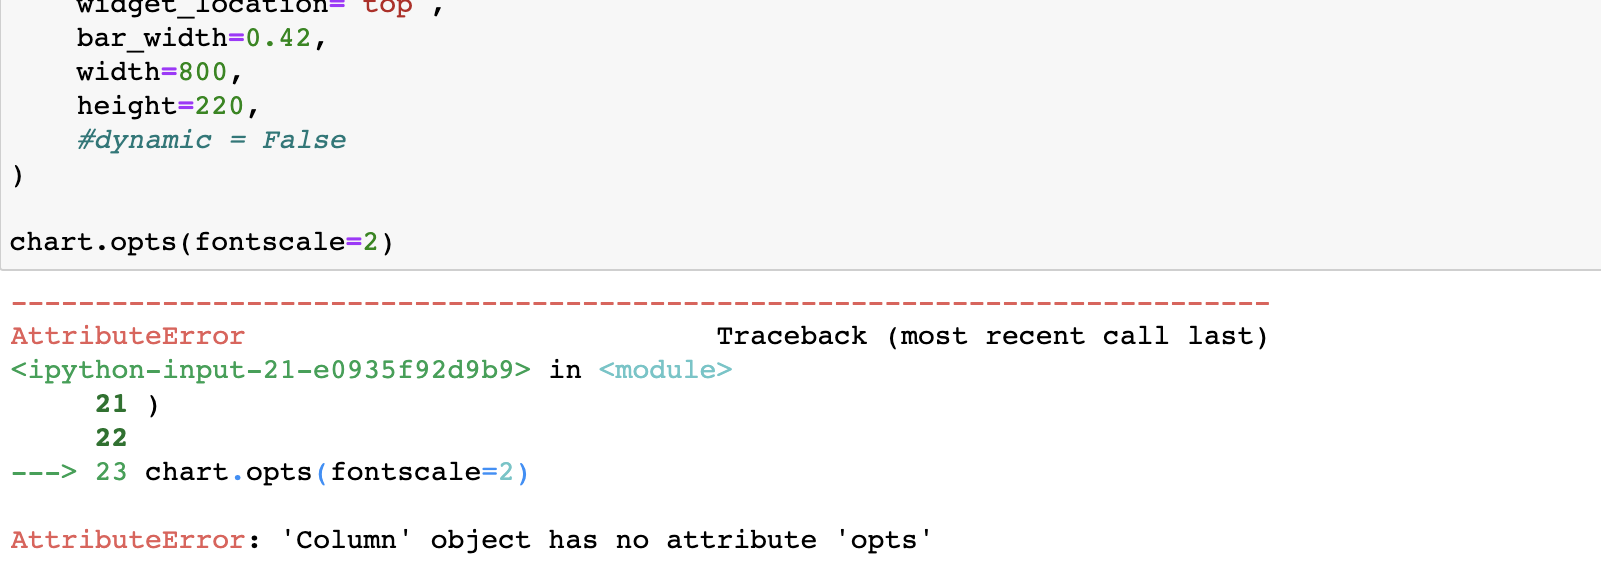
Screenshot error when adding opts to the chart
It seems like this bug is still present in hvplot version 0.8.4. Any updates on this issue @maximlt?
A workaround that worked for me was to remove the widget_location parameter.