Setting projection on hvplot with xlim and ylim zooms all the way into a single point
ALL software version info
(this library, plus any other relevant software, e.g. bokeh, python, notebook, OS, browser, etc) hvplot 0.7.2 cartopy 0.20.2 python 3.8.12 jupyterlab 3.0.16
Description of expected behavior and the observed behavior
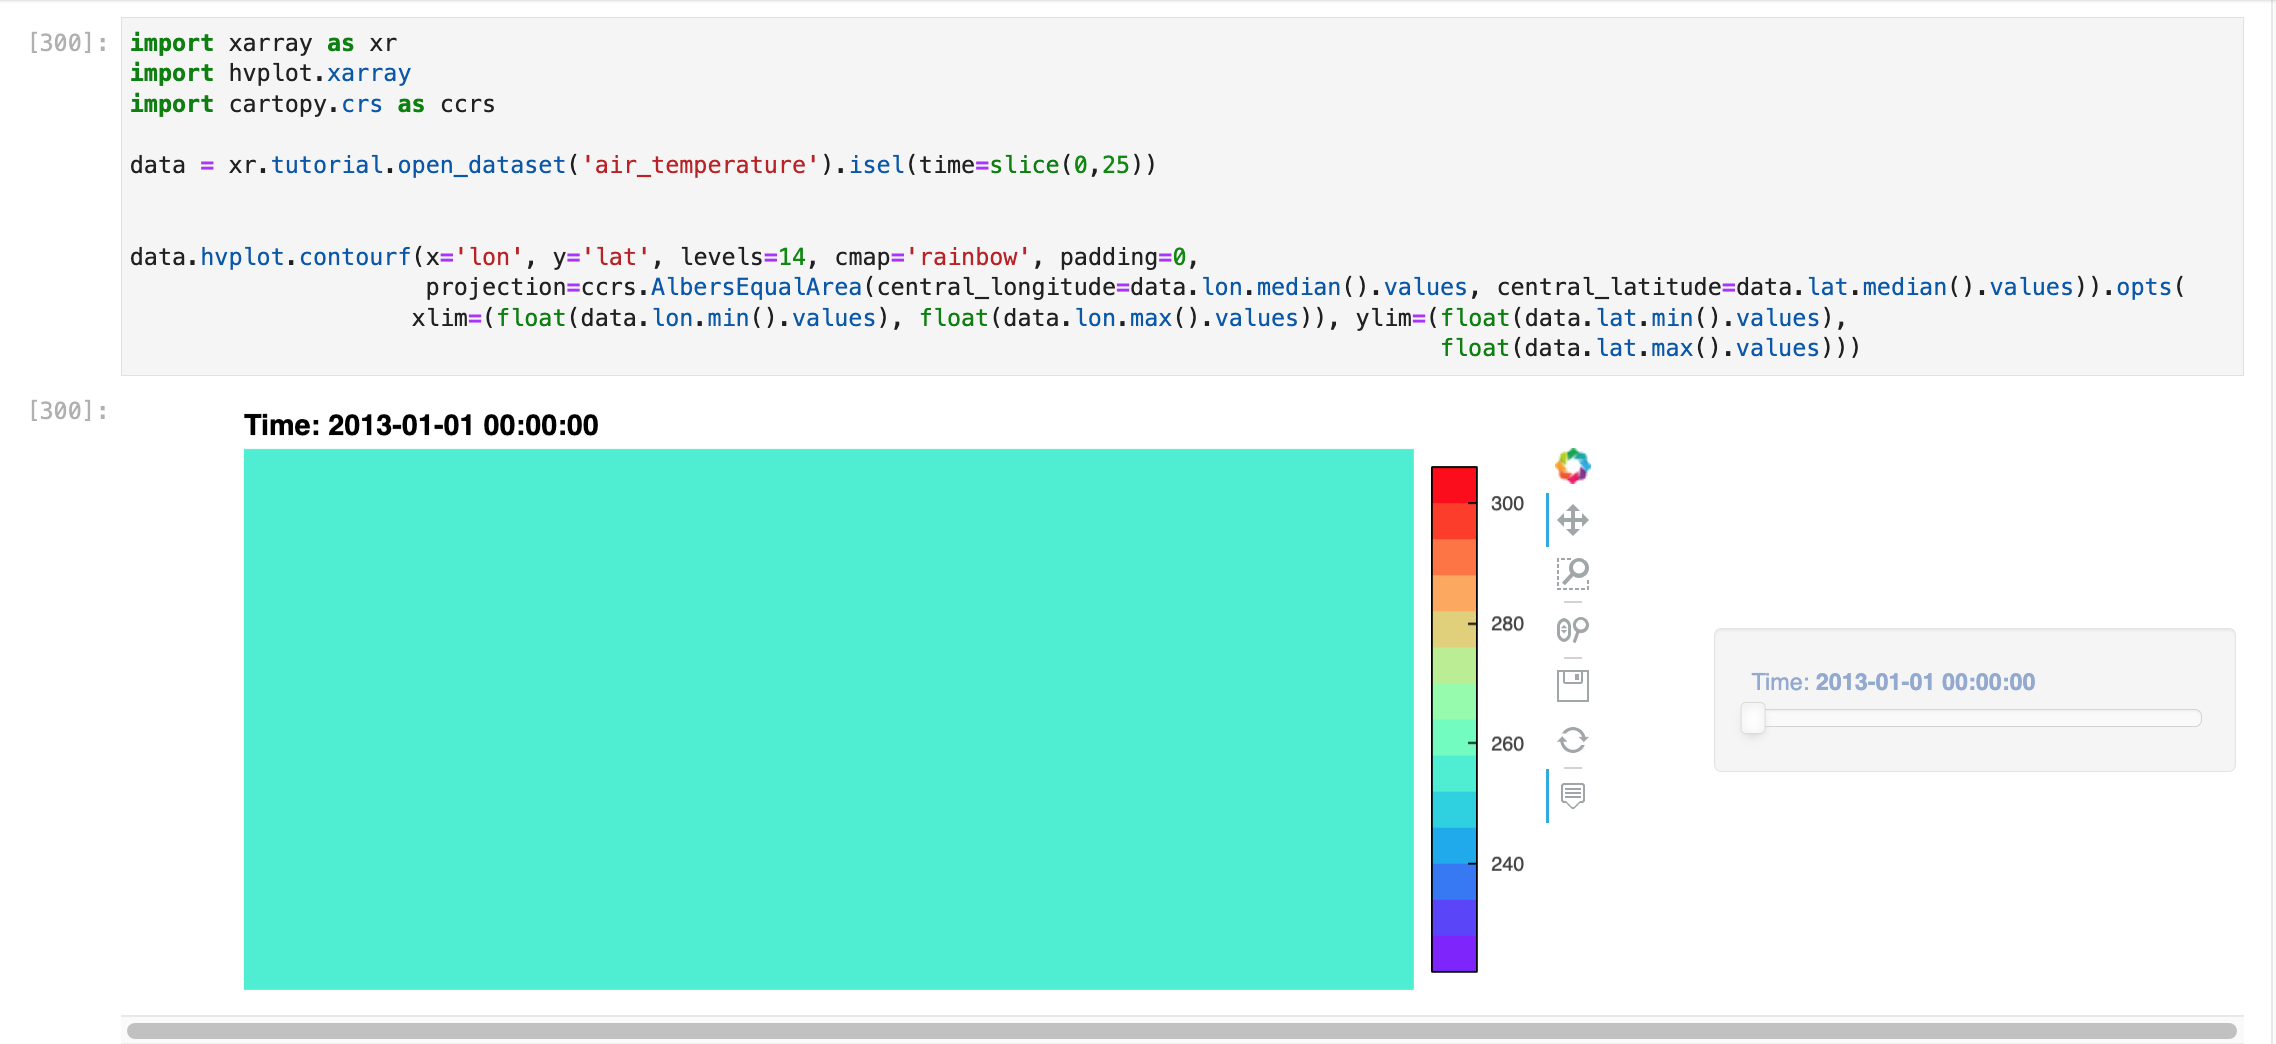
I expect that when I set a Cartopy projection on an hvplot of data that is regional with an extent/xlim + ylim set, it will show the proper xlim+ylim. Observed behavior is that when I do this, the plot view zooms all the way into a single point in the middle of the plot.
Complete, minimal, self-contained example code that reproduces the issue
import xarray as xr
import hvplot.xarray
import cartopy.crs as ccrs

data = xr.tutorial.open_dataset('air_temperature').isel(time=slice(0,25))


data.hvplot.contourf(x='lon', y='lat', levels=14, cmap='rainbow', padding=0,
                     projection=ccrs.AlbersEqualArea(central_longitude=data.lon.median().values, central_latitude=data.lat.median().values)).opts(
                    xlim=(float(data.lon.min().values), float(data.lon.max().values)), ylim=(float(data.lat.min().values), float(data.lat.max().values)))
Mouse zoom all the way out to see the whole plot.
Screenshots or screencasts of the bug in action
Hi there, would love this to get some attention if possible - plotting regional data is a common use of hvplot for my work and being able to project the plot is fairly important. Thank you!
I don't have GeoViews installed to test out your code, but it may be that xlim and ylim are in the projected coordinates while you're providing values in lat/lon. Maybe project the lat/lon values to your specified coordinates before passing to xlim/ylim? If that's the problem it's arguably a bug in hvplot, since presumably it should be projecting xlim and ylim as well, but it would make it clear what's happening as well as give you a workaround.
Just came across this while working on #1053.
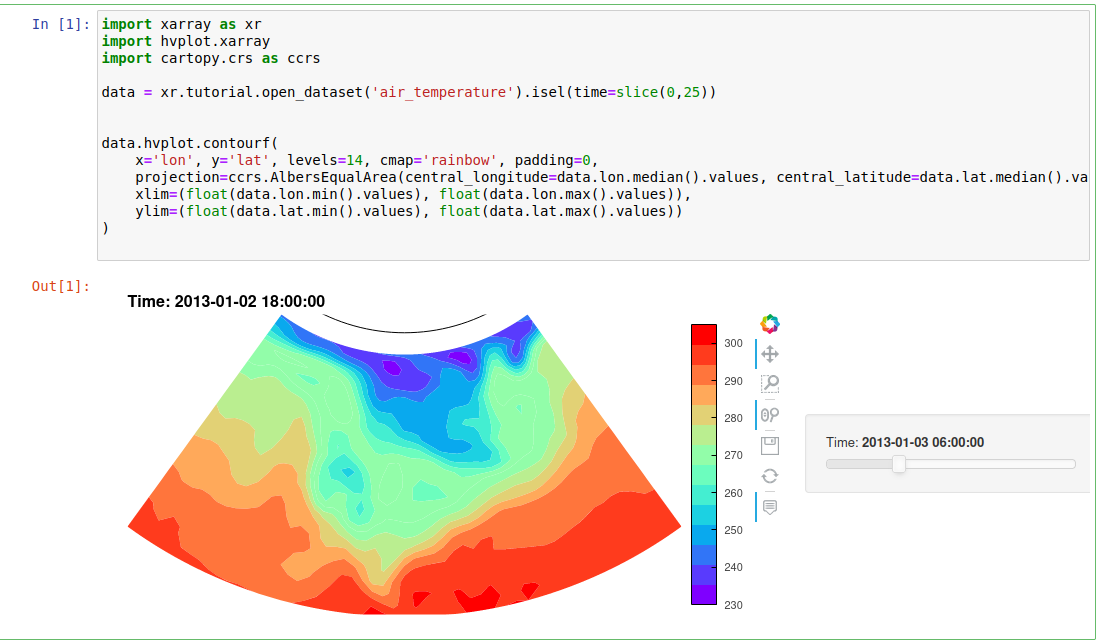
When projecting data it is better to include the xlim and ylim in the hvplot call itself rather than using .opts
import xarray as xr
import hvplot.xarray
import cartopy.crs as ccrs

data = xr.tutorial.open_dataset('air_temperature').isel(time=slice(0,25))

data.hvplot.contourf(
    x='lon', y='lat', levels=14, cmap='rainbow', padding=0,
    projection=ccrs.AlbersEqualArea(central_longitude=data.lon.median().values, central_latitude=data.lat.median().values),
    xlim=(float(data.lon.min().values), float(data.lon.max().values)),
    ylim=(float(data.lat.min().values), float(data.lat.max().values))
)
Hi @vlvalenti, did you try the suggestion above https://github.com/holoviz/hvplot/issues/769#issuecomment-1496595043 and are you still having this problem?