hvplot

hvplot copied to clipboard
HLine and VLine with groupby parameter
Is your feature request related to a problem? Please describe.
Let's say I have this xarray Dataset:
import xarray as xr
import holoviews as hv

t = np.linspace(0,1,20)
r = np.linspace(0,1,20)
temp = np.array([np.exp(-time*r) for time in t])
data = xr.Dataset()
data["t"] = t
data["r"] = r
data["temp"] = (["r", "t"], temp)

data
I can easily visualize the field temp change over time using
plot = data.temp.hvplot(groupby="t")
plot

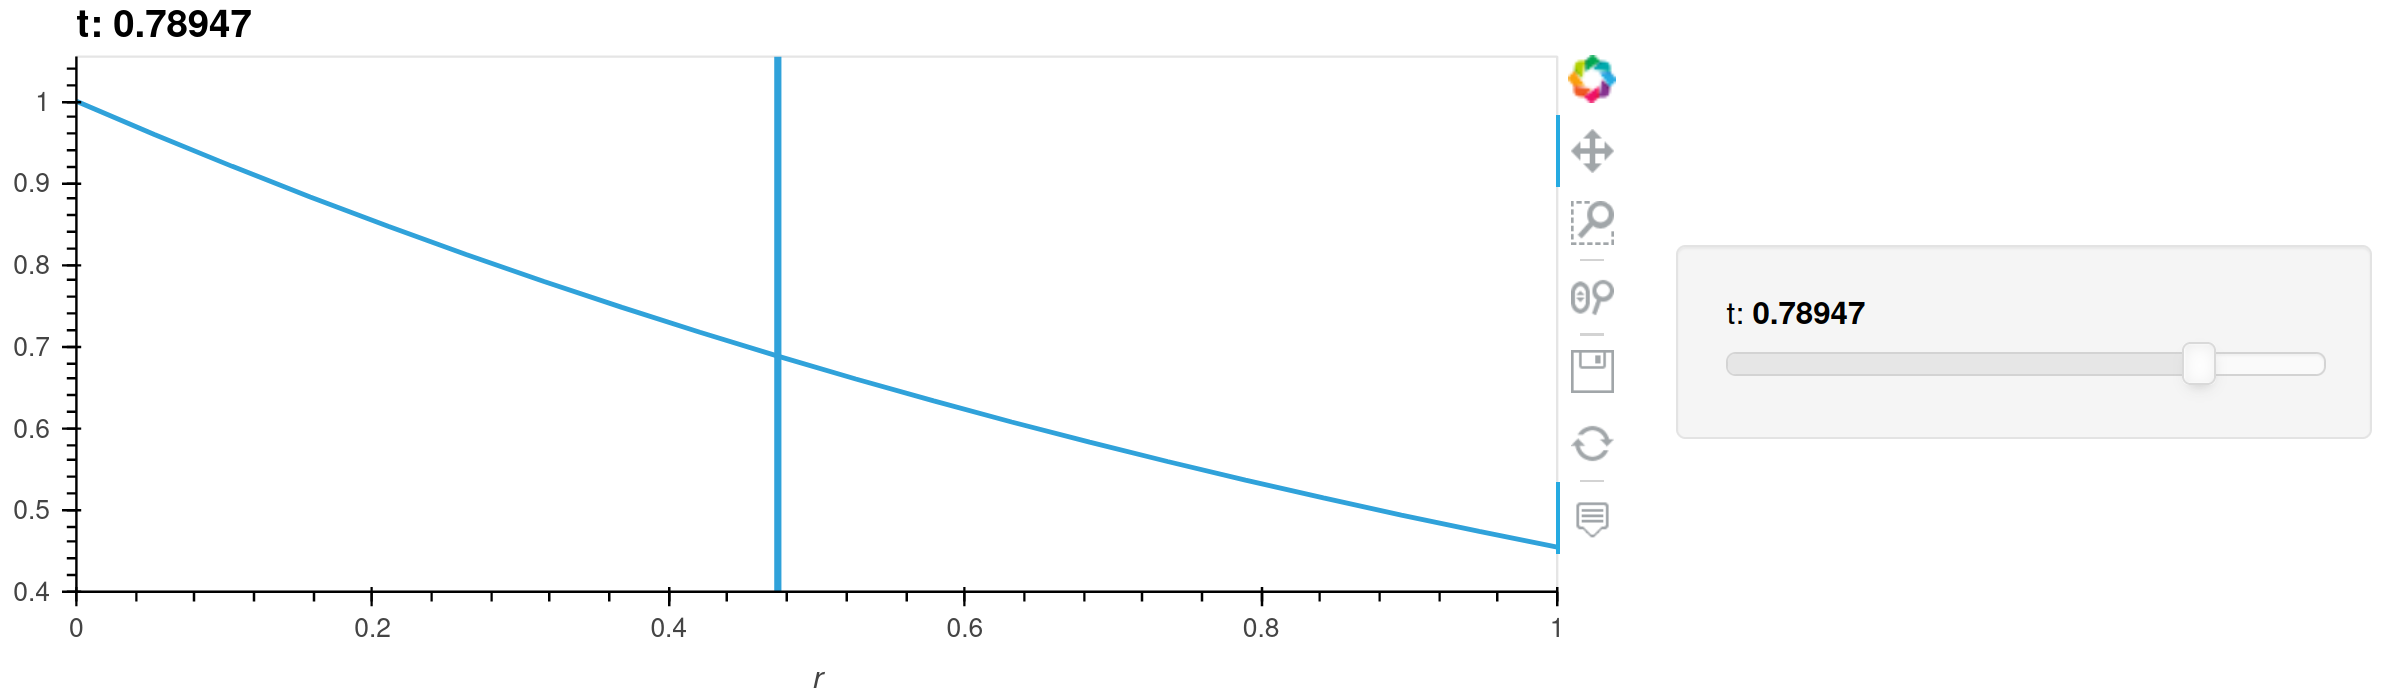
Next, I would like to visualize the radius where the field goes below a temp_threshold:
r_threshold = data.r.isel(r=(data.temp<temp_threshold).argmax("r")).drop("r")
Since this is a time dependent quantity, I can't just use hv.VLine to visualize this quantity.
Describe the solution you'd like
It would be nice if I could now do something like:
plot *= r_threshold.hvplot.VLine(groupby="t")
plot
This would now overlay a VLine that corresponds correctly to changes of the "t" slider.
Describe alternatives you've considered
One could of course manually construct a HoloMap and overlay it with the plot, but this introduces some complexity everytime I would like to do something like this (which is often).
This is how I managed to do it:
vlines = {float(data.t[i]): hv.VLine(float(r_threshold[i])) for i in range(int(data.dims["t"]))}
plot *= hv.HoloMap(vlines, kdims="t")
plot