hvplot

hvplot copied to clipboard
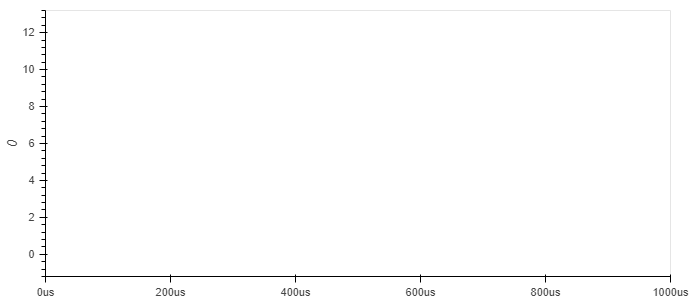
period indexed data frame causes time axis range to be incorrect
ALL software version info
hvplot.version '0.5.2'
Description of expected behavior and the observed behavior
The code below causes time axis to be in the microseconds range whereas the data frame is in the year range.
One can manually zoom out and see the data plotted so it is just an issue of calculating the range of the time axis correctly
Complete, minimal, self-contained example code that reproduces the issue
import pandas as pd
df=pd.DataFrame(data=range(13),index=pd.period_range('1990','1991',freq='M'))
df.hvplot()
Screenshots or screencasts of the bug in action