how to sort grouped bar charts
The grouped bar chart seems to sort alphabetically by group name, column A in my example below. However, I'd like to sort the chart by the values of column B. df.sort_values doesn't seem to work.. Could you please let me know how to sort bart charts like this? Thanks!
df = pd.DataFrame([['group B', 10, 30],['group A',20, 40],['group C',15, 10]], columns=['A','B','C'])
df.sort_values(by='B').hvplot.bar('A',['B','C'])
This appears to be a holoviews issue since the data are properly sorted in the plot.data property and holoviews creates the same plot.

Transferred this back to hvPlot, there is now an API to do this but it would be good to expose it in hvPlot.
i actually need this and I have contributed to sorting in holoviews so I will make a PR soon.
This has been fixed in HoloViews, we just need to expose options in hvPlot now.
I think if you install the latest versions, it's actually already working for the example you gave:
pip install git+https://github.com/holoviz/holoviews.git pip install git+https://github.com/holoviz/hvplot.git
df = pd.DataFrame([['group B', 10, 30],['group A',20, 40],['group C',15, 10]], columns=['A','B','C'])
df.sort_values(by='B').hvplot.bar('A',['B','C'])

If for some reason this is not working you can also do (as a workaround):
df = pd.DataFrame([['group B', 10, 30],['group A',20, 40],['group C',15, 10]], columns=['A','B','C'])
order = df.sort_values(by='B').A
df.hvplot.bar('A',['B','C']).redim.values(A=order)
This code also sorts on B (ascending)
Actually I'm not entirely clear what the expected behavior even should be. It indeed already tries its best to respect the sort order, but for a two-category ordering this can be ambiguous. A PR to allow you to explicitly specify the categories for each level would therefore be appreciated.
Here an example am working, trying to get bar chart with specific order, but not able to make it work, is there an option am missing or is related to this open issue?
df = pd.DataFrame([
['group B', 'EC20', 30],
['group B', 'EC11', 80],
['group B', 'EC19', 5],
['group A','EC20', 40],
['group A','EC27', 80],
['group A','EC22', 43],
['group A','EC18', 45],
['group A','EC24', 90.1],
['group A','EC25', 240.2],
['group A','EC26', 41],
['group C','EC24', 14],
['group C','EC15', 10],
['group C','EC17', 110],
['group C','EC18', 22],
['group C','EC19', 53],
], columns=['A','B','Values'])
#not getting expected order (Chart A)
#onnly first column gets ordered
df.sort_values(by=['A','Values'],**p).plot(kind='bar',x='A',y='Values',by='B',stacked=True,height=400)
#making unique the grouping parameter
df['A+B'] = df['A'] + '|'+ df['B']
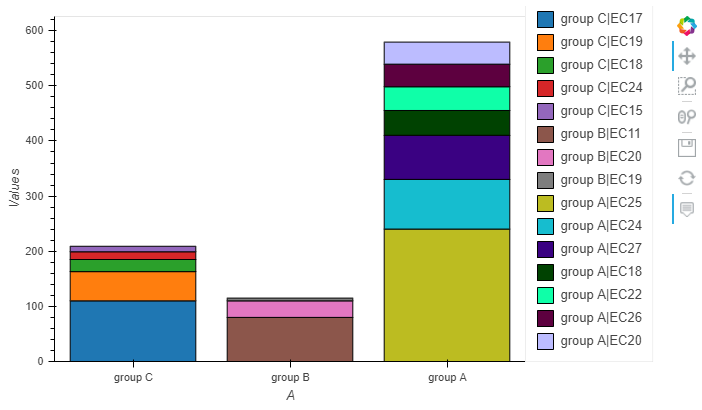
#having expected sort but legend gets cluttered (Chart B)
df.sort_values(by=['A','Values'],**p).plot(kind='bar',x='A',y='Values',by='A+B',stacked=True,height=400)
Chart A

Chart B
Holoviews 1.14.1
