No plot produced when xticks and xtick labels specified in hvplot
Hi, I notice that when I specify xticks as a list of tuples of (coordinate, label), no plot is produced. If I don't include this option, then I get a plot. See example below.
import pandas as pd
import hvplot.pandas
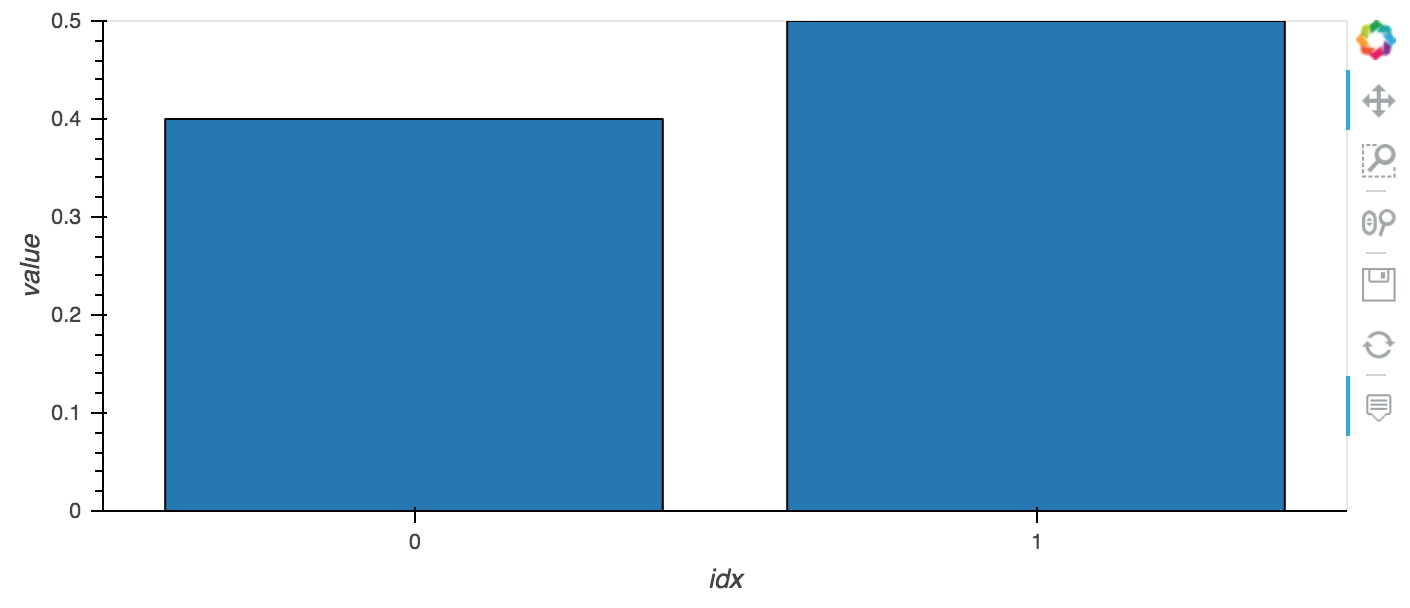
test = pd.DataFrame({'idx': [0, 1], 'value': [0.4, 0.5]})
(
test
.hvplot(
x='idx',
y='value',
kind='bar'))
test = pd.DataFrame({'idx': [0, 1], 'value': [0.4, 0.5]})

(
    test
    .hvplot(
        x='idx',
        y='value',
        kind='bar',
        xticks=[(0, 'a'), (1, 'b')]))
I am using pandas version 0.25.1, hvplot version 0.4.0, inside Jupyter Lab version 1.1.4
xticks is for annotating a numerical axis, typically a continuous range where one can decide how often to put a marker. A Bokeh bar chart uses a categorical axis, even if the labels on the bars are numerical as they are here, which doesn't support numerical options like xticks. I'd like there to be a continuous numerical bar chart available, for things like histograms, but it's not yet supported. So here the issue is presumably that there should be a helpful, visible error message returned to Python. My guess is that there is already such a message if you look at your browser's JavaScript console (for Chrome it's cmd-option-J on Mac, ctrl-shift-J on Windows).
This produces a plot now, but not correctly:
test = pd.DataFrame({'idx': [0, 1], 'value': [0.4, 0.5]})

(
    test
    .hvplot(
        x='idx',
        y='value',
        kind='bar',
        xticks=[(0.5, 'a'), (1.5, 'b')]))

This produces a plot now, but not correctly
Interestingly this is no longer true, the plot isn't displayed at all.
I also have noticed this issue. When the xticks option is set, the plot does not display at all. It returns an empty output. However, if I use yticks instead of xticks, the graph displays as expected.
sensor_data.hvplot.line(x='Timestamp', y='AIT402', xticks=5)
I am also experiencing this- if xticks is set, there is no plot at all.