hvplot
 hvplot copied to clipboard
Move Legend on `hvplot.scatter_matrix` ?
I am having a hard time find any documentation on how to move the legend outside of the subplots. Is it possible to have a single legend? I can't see any of the scatter plots with the legend turned on.
My code:
hvplot.scatter_matrix(df, c='label', show_legend=True)
Thanks
Unfortunately, I don't think there's a proper way to do it yet, but philippjfr did share a similar hack like this a while back on gitter. (If you don't have a scatter matrix, you can set legend_position='right' for it to be outside)

from bokeh.sampledata.iris import flowers
import hvplot.pandas

hvplot.scatter_matrix(flowers, c='species') + \
flowers.hvplot.scatter('sepal_length', 'sepal_width', by='species', legend='top_right', width=150, height=150
                      ).opts('Scatter', size=0, xaxis=None, yaxis=None, show_frame=False, toolbar=None)
I am trying to do some EDA on the sklearn breast cancer dataset.
Using your hack above I can successfully add a legend to a scatterplot_matrix:
hv.extension("bokeh")
matrix = hvplot.scatter_matrix(df.drop("target_name",axis=1),c="target")
legend_cheat=df.drop("target_name",axis=1).hvplot.scatter('mean area', 'worst area', by='target', legend='right',
                                                         width=150, height=150
                                                         ).opts('Scatter', size=0, xaxis=None, yaxis=None,
                                                         show_frame=False, toolbar=None)
matrix + legend_cheat
The plot is too large to show in full, however here is the top right hand corner with the legend:
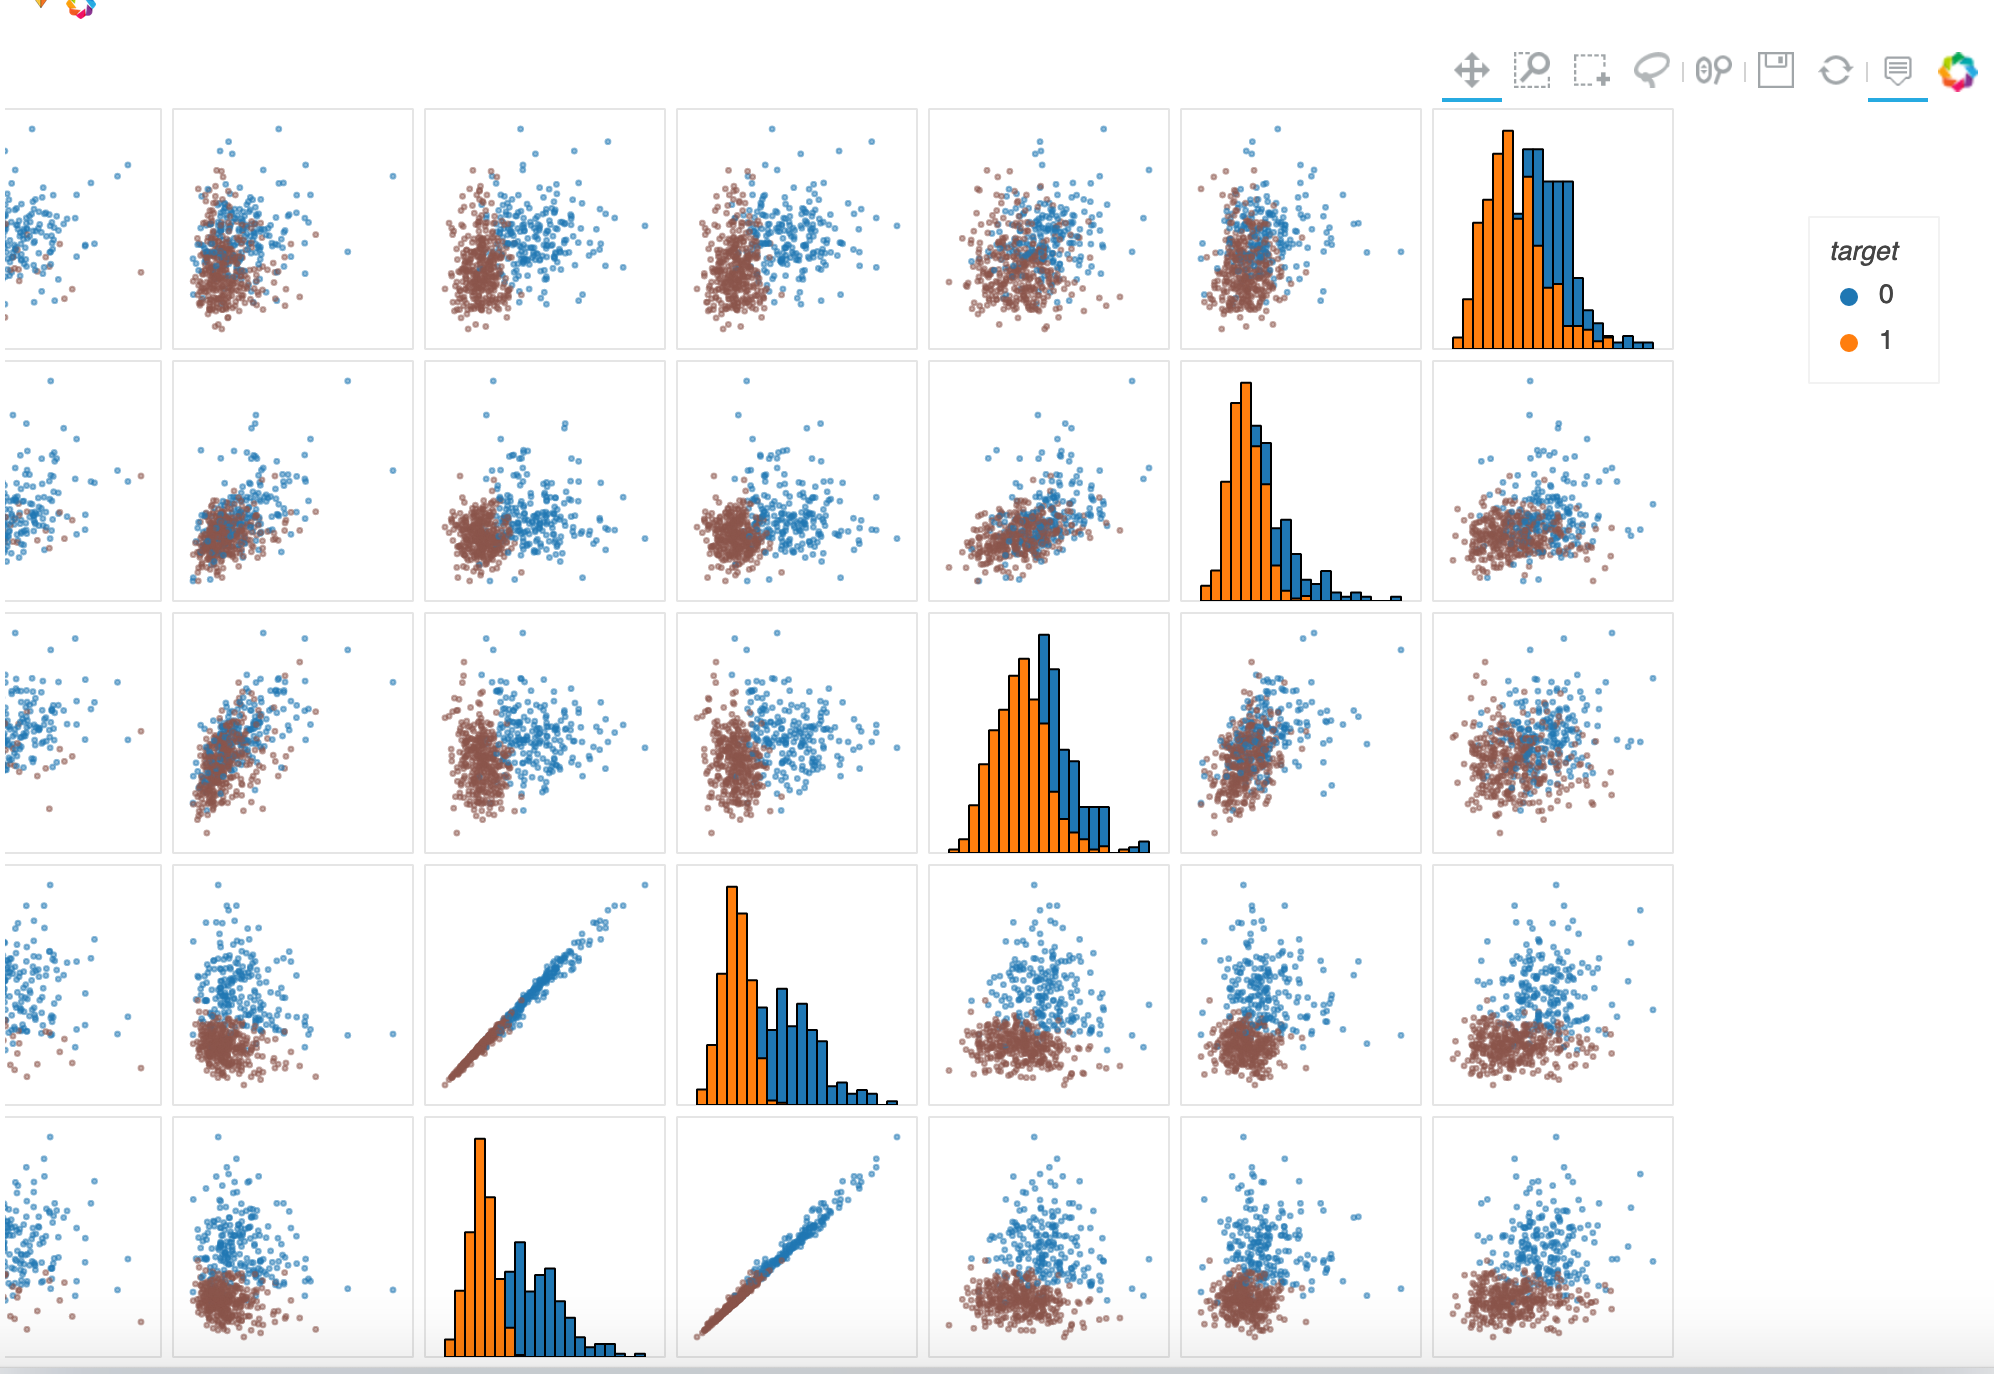
Is there a way to force the scatter_plots,histograms and legend to all use the same colours? I thought that setting c="target" would make the colour of the entire scatter_matrix (ie scatter plots and histograms) the same as per your above example?