holoviews
 holoviews copied to clipboard
ENH Stickplots
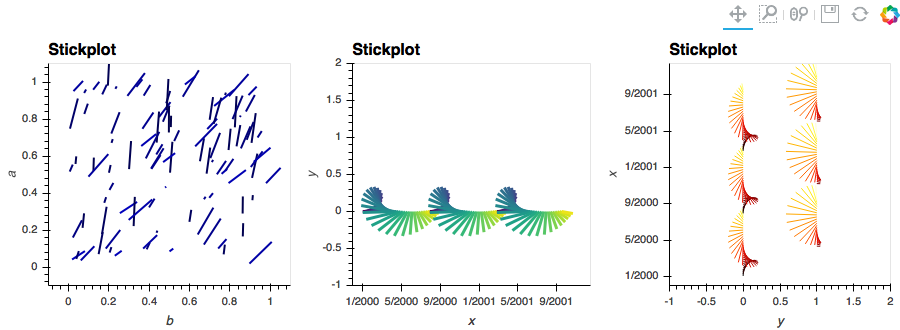
Just a draft for what I know by the name of "Stickplots" (probably mostly because that's what a popular script for Matlab is called) - see https://github.com/pyviz/holoviews/issues/3486#issue-408802672. This is only for the bokeh backend - Ray is the only Element I know that actually allows specifying an angle on the canvas itself. This is important when one wants to use datetime axes (see #2467), as one often does in these plots (of e.g. wind direction/speed as a function of time). I've previously made these plots in matplotlib (and Matlab), but then you have to work with the aspect ratio (tends to be a mess).
Syntax is like VectorField's: hv.Sticks((time, y, angles, magnitudes)).
This is certainly not ready to be merged, but I wanted to hear your opinions before I write tests etc. I'm not married to any of the specifics (name of the Element, number of kdims, ...).
How do you feel folding this behavior into VectorField or do you think that's overloading it too much?
Thanks for contributing this! To me merging it makes sense from a user perspective, because it just lifts a restriction on VectorField that the axes be commensurate, rather than being a fundamentally different type of visualization.
To me merging it makes sense from a user perspective, because it just lifts a restriction on VectorField that the axes be commensurate, rather than being a fundamentally different type of visualization.
I don't follow, you seem to be arguing that it should just be folded into VectorField but also that we should merge this new hv.Sticks element?
Oops; I shouldn't have used the loaded term "merge" on github!! I meant folding this functionality into VectorField, not merging this PR as-is!
I agree the type of visualisation isn't fundamentally different, but I find this a bit tricky to wrap into VectorField.
The "you can have datetime axes but then you don't get arrow heads" bit might be confusing to users, no? Also e.g. VectorField's pivot options don't really make sense with these rays as they are fundamentally pivoted at the "tail" (although one could add a ray going into the opposite direction as a workaround). In addition to which I'd eventually like to see VectorField support specifying vectors by their x/y components, which again doesn't make sense using Ray.
Maybe just calling the Element something like 'Rays' might be suited and makes it clear to the user where the difference lies? Angles in data space vs angles on the screen?
@ahuang11 do you have an opinion here? I recall you were trying to use a datetime axis in a VectorField.
Doesn't it make sense to add arrowheads to a stickplot and remove them from a vector field plot, and vice versa? Seems to me like enabling or disabling arrowheads is just a plot option, not a distinction between two types of plot. Same for pivoting around the center or around the tip; that seems like a choice a user could rationally wish to make independently of all other choices (again making it a plot option). I don't have any opinion about x/y versus angle/magnitude yet.
I agree with you in principle except I don't know how to implement this in bokeh currently. Maybe I'm just too unfamiliar with bokeh - I thought arrowheads could only be added to Arrow annotations? If you're talking about manually adding in the arrow heads like is currently done in VectorField - this would run into the same aspect ratio issues that I tried to avoid by using Ray in the first place.
I thought arrowheads could only be added to Arrow annotations?
We should still explore whether we can do this easily. I'll take a look at your PR over the weekend.
I agree if there is a possibility to wrap them together into VectorField we should.
Just updated this one to latest master as I've been looking at it again.
Some more thoughts RE: merging this into vectorfields:
- One feature I could potentially be interested in is datashading these plots. Currently the bokeh ray elements can't be datashaded (I think), but I assume this should be feasible(?) Wheres bokeh VectorField elements are really a composite of hand-crafted arrowheads that twist with zooming and changing x/y scales and cannot really feasibly be datashaded.
- VectorFields consider the angles in data coordinates, whereas stick plots have the angles in paper coordinates (e.g. independent of x/y scales. Integrating the two necessitates another plot option.
- datetime axes make no sense for Vectorfields, but certainly for stickplots.
In short, regarding merging stickplots into vectorfields, I'd be afraid of getting vectorfield too crowded and stretching the semantics too far. But I'm happy either way as long as the functionality is there.
One way or the other I'm interested in getting this into holoviews soon-ish to be able to implement it in GeoViews.
Codecov Report
Merging #3504 (a42e759) into master (4eb9e51) will decrease coverage by
0.04%. The diff coverage is28.26%.
@@            Coverage Diff             @@
##           master    #3504      +/-   ##
==========================================
- Coverage   86.71%   86.66%   -0.05%
==========================================
  Files         299      299
  Lines       62204    62249      +45
==========================================
+ Hits        53939    53951      +12
- Misses       8265     8298      +33
| Impacted Files | Coverage Δ | |
|---|---|---|
| holoviews/plotting/bokeh/__init__.py | 97.24% <ø> (ø) |
|
| holoviews/plotting/bokeh/chart.py | 84.53% <21.42%> (-4.08%) |
:arrow_down: |
| holoviews/element/chart.py | 96.84% <100.00%> (ø) |
|
| holoviews/element/geom.py | 100.00% <100.00%> (ø) |
Continue to review full report at Codecov.
Legend - Click here to learn more
Δ = absolute <relative> (impact),ø = not affected,? = missing dataPowered by Codecov. Last update 4eb9e51...a42e759. Read the comment docs.