geoviews
 geoviews copied to clipboard
Cannot display across UTM boundaries
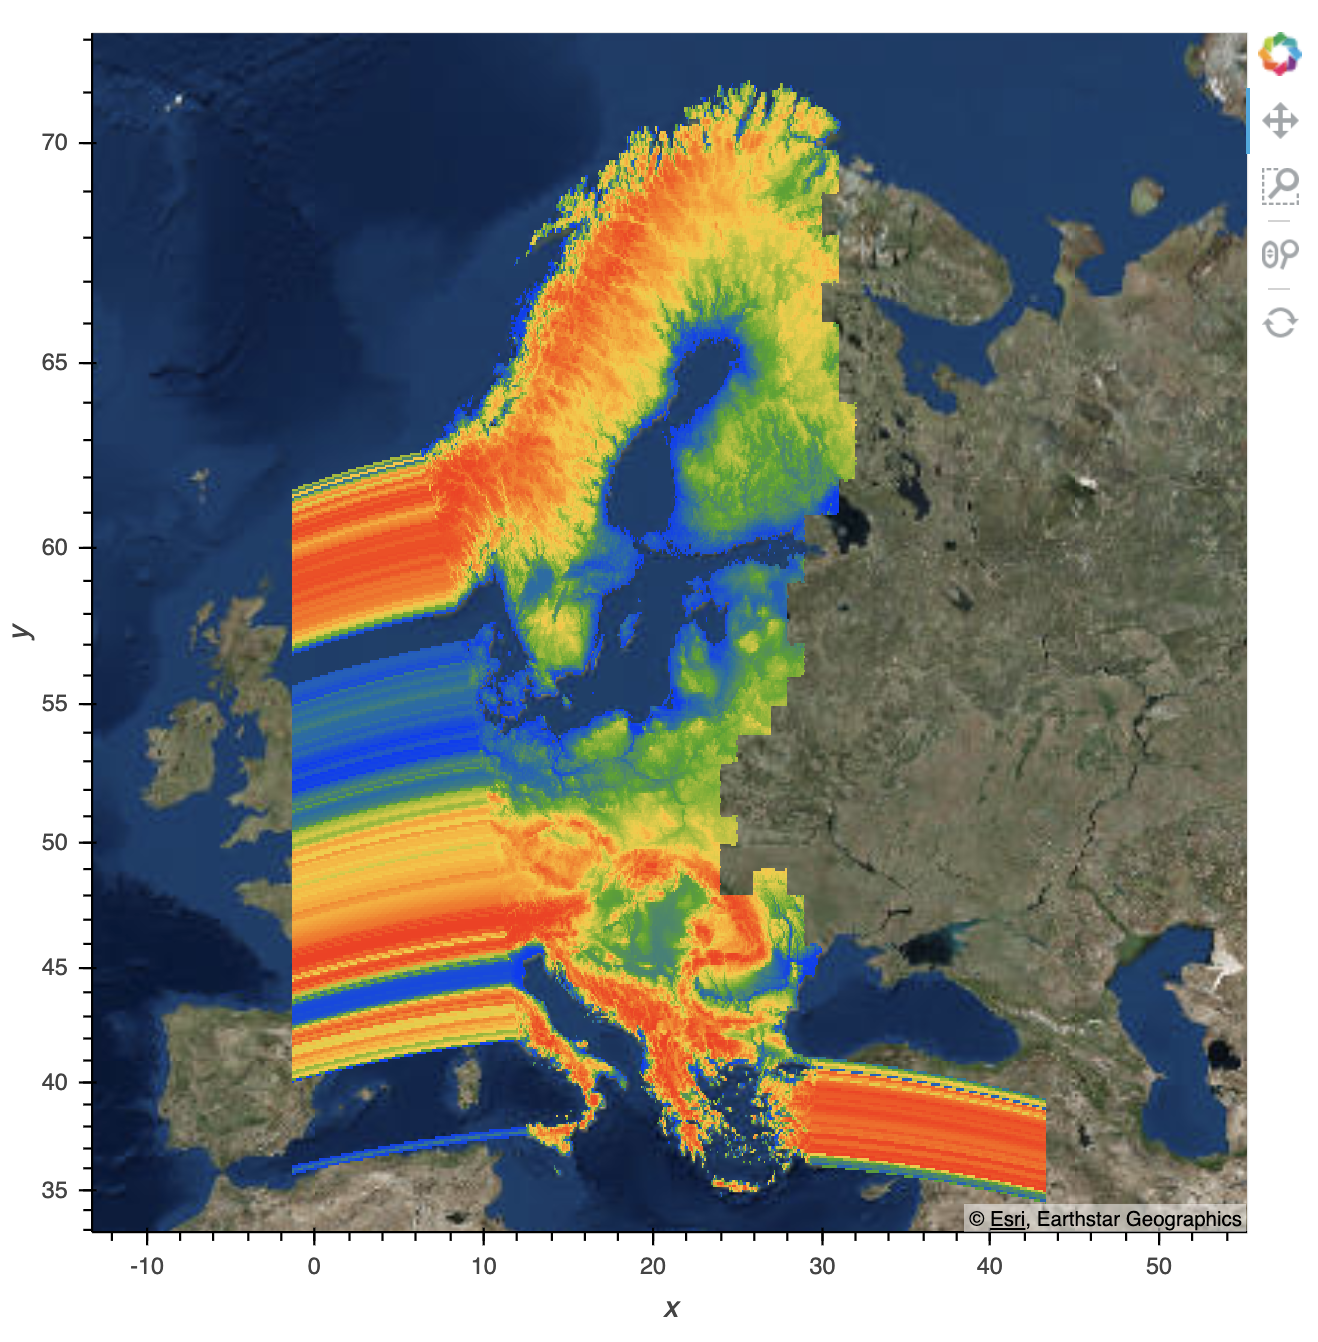
I have a dataset that is UTM that I'm displaying as gv.Points. The dataset extents are beyond the value of the particular UTM zone (I acknowledge the inaccuracy of such a thing). It appears that geoviews cannot plot beyond the extents of the UTM zone. That seems odd to me since its just a flat projection and should plot beyond the zone easily.
The behavior I'm seeing seems to be an initial plot showing the data properly in the UTM zone, then the screen flashes, and the remaining data outside the zone appears to smear across the screen.
This is after the screen flashes (its fully loaded):
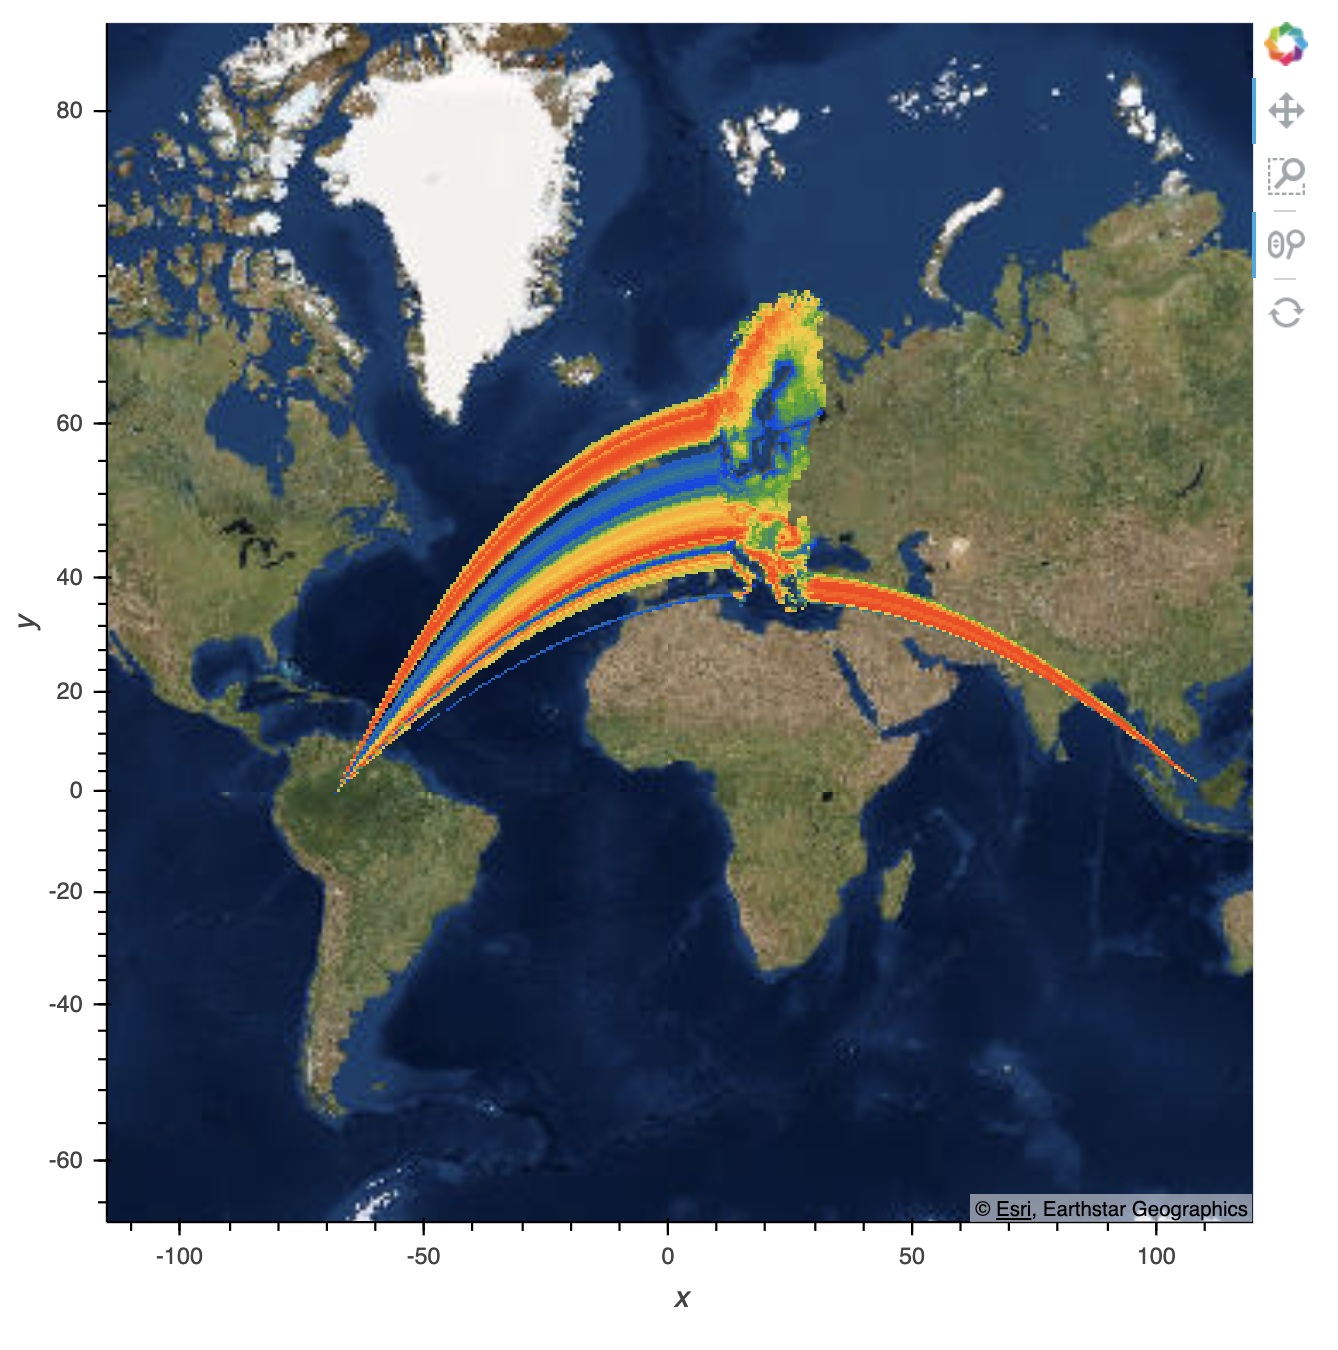
And if I then zoom out, it reloads to this:
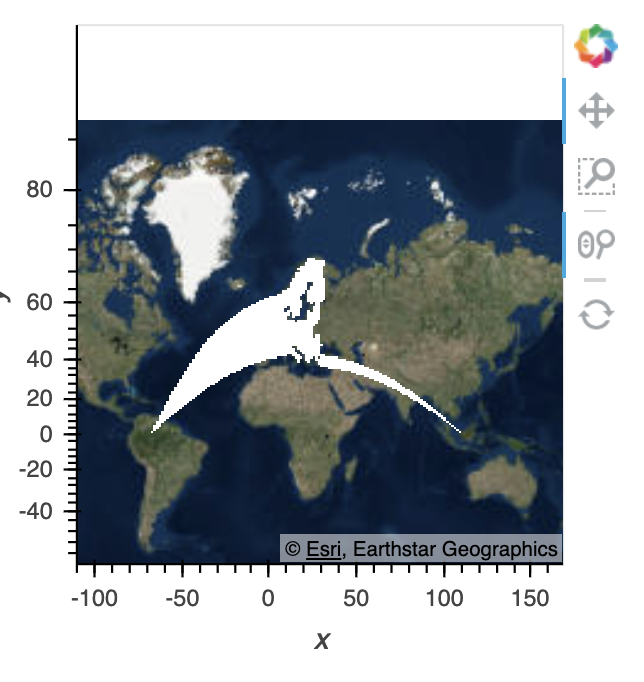
I also have a trimesh which is an entirely different dataset, but covers the same area as the gv.Points data. It renders incorrectly in the same way:
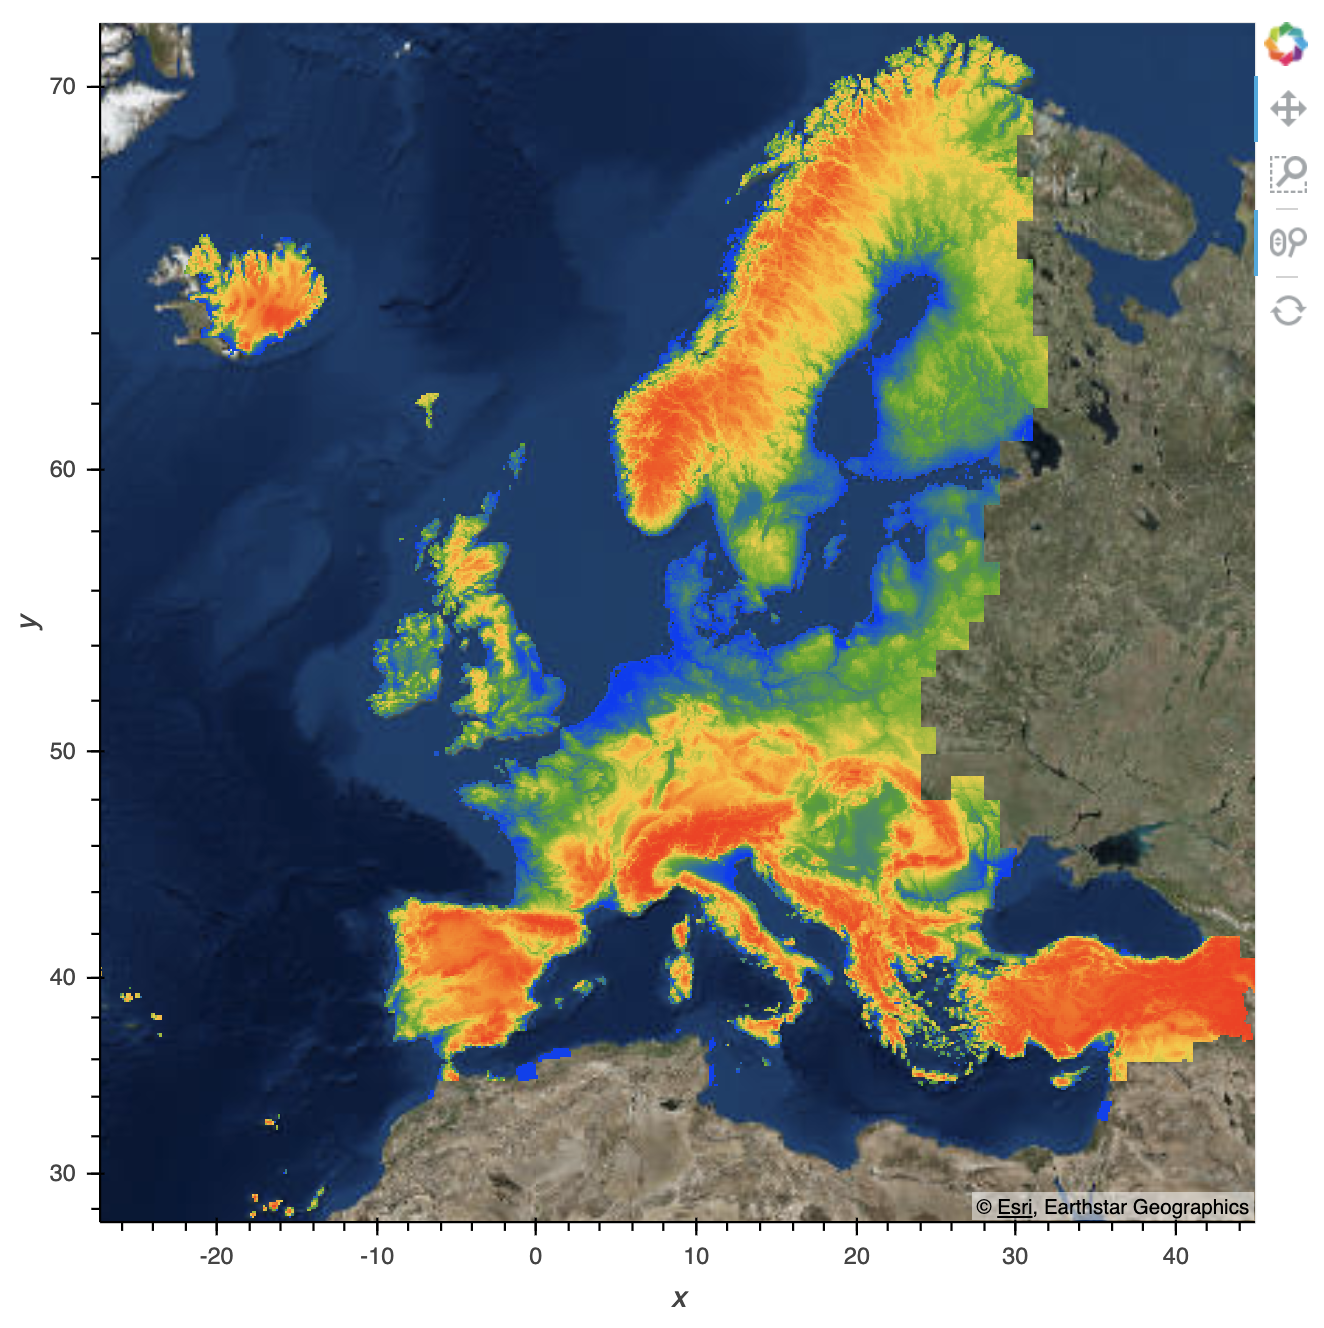
If I reproject my points into Mercator before plotting, you can see the data plotted properly here:
I'm not sure if this is related to #318 . I tried to make something similar happen with the data in that issue, but wasn't able to. I can give you a copy of this data but its 850 MB so I can't share it here.
I have the obvious workaround of reprojecting into mercator before displaying, but I wonder if the data in the points object itself is also incorrect? Or is it just in the rendering?
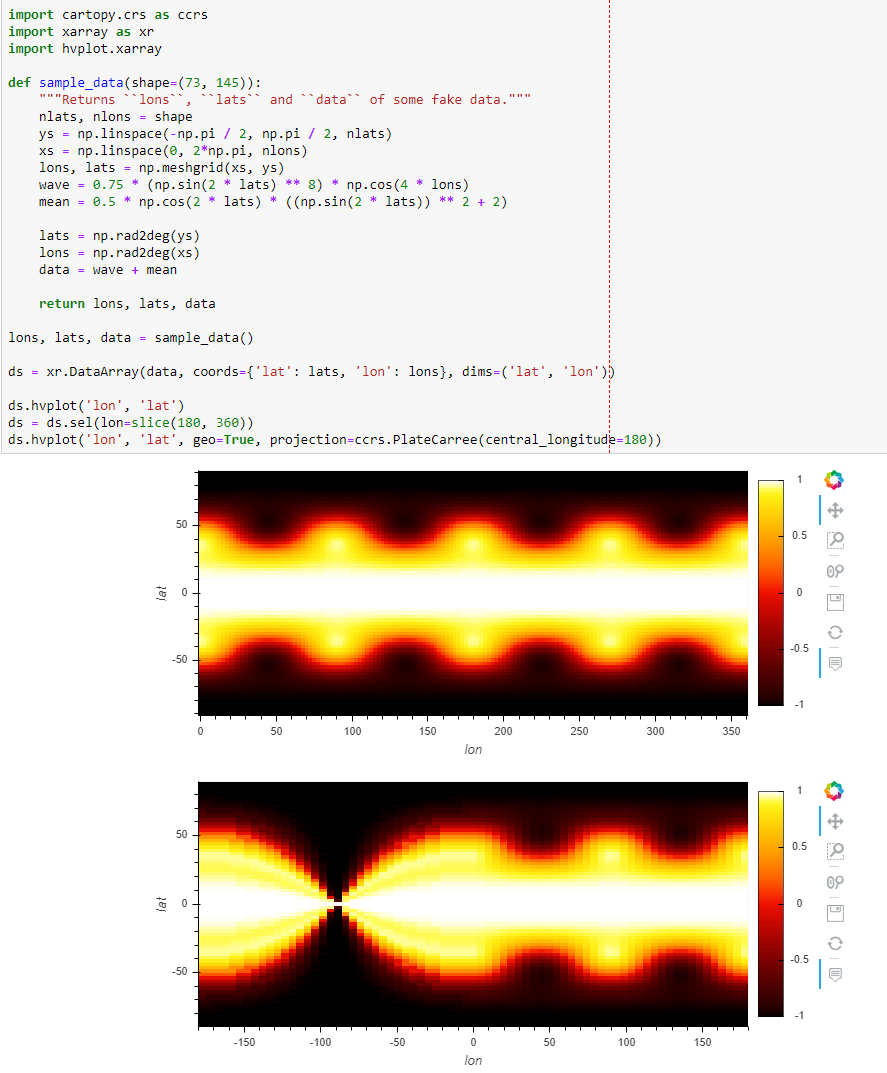
I think I encountered something similar recently, replicated with this arbitrary global dataset. After selecting 180 to 360, there's that weird bottleneck at 0.
import cartopy.crs as ccrs
import xarray as xr
import hvplot.xarray

def sample_data(shape=(73, 145)):
    """Returns ``lons``, ``lats`` and ``data`` of some fake data."""
    nlats, nlons = shape
    ys = np.linspace(-np.pi / 2, np.pi / 2, nlats)
    xs = np.linspace(0, 2*np.pi, nlons)
    lons, lats = np.meshgrid(xs, ys)
    wave = 0.75 * (np.sin(2 * lats) ** 8) * np.cos(4 * lons)
    mean = 0.5 * np.cos(2 * lats) * ((np.sin(2 * lats)) ** 2 + 2)

    lats = np.rad2deg(ys)
    lons = np.rad2deg(xs)
    data = wave + mean

    return lons, lats, data

lons, lats, data = sample_data()

ds = xr.DataArray(data, coords={'lat': lats, 'lon': lons}, dims=('lat', 'lon'))

ds.hvplot('lon', 'lat')
ds = ds.sel(lon=slice(180, 360))
ds.hvplot('lon', 'lat', geo=True, projection=ccrs.PlateCarree(central_longitude=180))
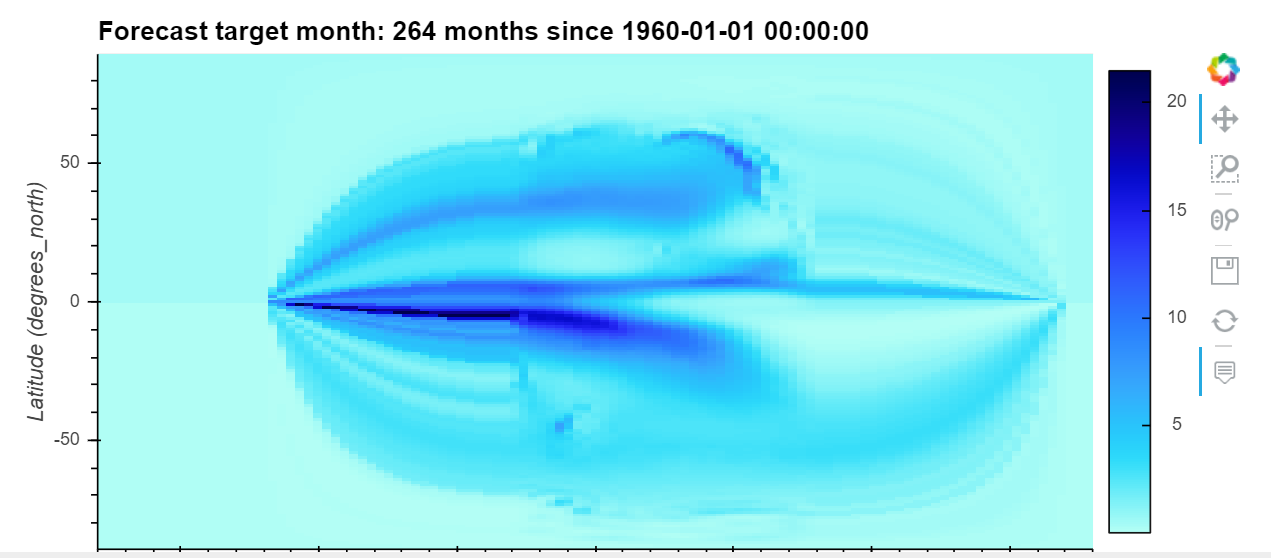
A reproducible example
import os
import xarray as xr
import hvplot.xarray
BASE_URL = 'https://ftp.cpc.ncep.noaa.gov/NMME/clim/'
os.system(f'wget -nc {BASE_URL + "CFSv2.prate.01.mon.clim.nc"}')
ds = xr.open_dataset('CFSv2.prate.01.mon.clim.nc', decode_times=False).sel(
lon=slice(150, 260))['clim']
ds.hvplot('lon', 'lat', geo=True, projection=ccrs.PlateCarree(central_longitude=180))
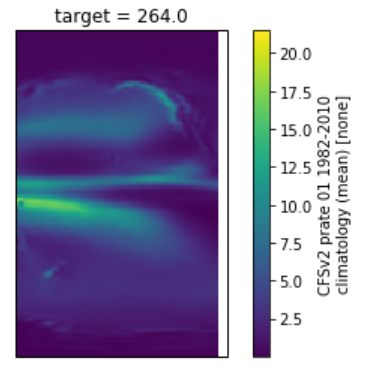
import cartopy.crs as ccrs
import matplotlib.pyplot as plt
plt.axes(projection=ccrs.PlateCarree())
ds.isel(target=0).plot(x='lon', y='lat', transform=ccrs.PlateCarree(central_longitude=180))
output:
expected: