Add non-zero line and dot widths, for visibility and antialiasing
[I thought this was already described in an issue, but if so I can't find it. Closest I can locate is #326.]
Datashader's line and points plotting is designed around a mathematical ideal where lines are zero in width and points are zero in extent. For a count aggregation, each pixel in the aggregate array will then report the number of points that fall into that cell or lines that cross that cell, which is very well defined mathematically. E.g. with infinitely many points drawn from a distribution, such a scatterplot or heatmap will represent that distribution faithfully, up to the limited resolution of the aggregate array.
However, in the real world, there are never infinitely many points, and sometimes it's important to see each point or line individually, particularly when zooming in far enough that only a few points or lines are visible. That's why Datashader includes the spread and dynspread commands, which make individual points and lines more visible, but those commands operate on the final image rather than during the aggregation stage, making them a useful hack on top of the mathematically ideal processing of infinitesimal quantities, rather than a precisely defined model for a different situation. The same is true for the x_sampling and y_sampling arguments to holoviews' aggregate operation, which reduce the resolution when zoomed in enough, again making points visible (though as blocky grid cells in that case).
A related issue is that individual datashaded lines look "blocky" -- each pixel is either on or off depending on whether the infinitely thin line crosses it or doesn't cross it, making a sharp transition between array columns and rows rather than the smooth antialiased lines we are used to from other modern software. There's a very good reason for this, in that it allows the superposition of huge numbers of lines to be meaningful, but it still looks bad and makes it more difficult to see each line.
To deal with these issues, we could define a width (defaulting to zero) to associate with lines and points in Datashader, probably expressed in "screen coordinates", where a distance of 2.5 would cover 2.5 rows or columns in the aggregate array. Using this value, each pixel in the aggregate array would then be incremented by the fraction of that pixel that is covered by the given shape (line or dot), resulting in coloring like:
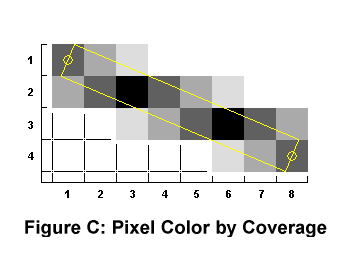
Note that with a non-zero width, a "count" aggregation would no longer be integer, because it would be the sum of the fractions of pixels covered. Dots (and any similar shape) would work similarly.
Implementing this has always been planned, but I don't think it was ever properly documented, and we certainly don't seem to be getting around to it any time soon, hence this issue to record it as a plan.
Partially addressed by https://github.com/holoviz/datashader/pull/916 , but only for a nominal single-pixel width.