Speckled lines with add_line_series and large data sets
Version of Dear PyGui:
Version: 0.6.177
OS
Operating System: Windows 10
My Issue/Question
When plotting a large data set with add_line_series, there appears to be black pixels speckled on the line.
To Reproduce
Steps to reproduce the behavior:
- Create a plot widget
- Add a line series to the plot with more than 50,000 data points. (10,000 seems to be the very minimum for this to occur)
- The plot can be either aliased or anti-aliased. The error occurs in both cases.
- See error as speckled black dots on the line.
Expected behavior
I would expect to see the no speckles and just see a solid line when viewing the whole plot, but I only see a solid line when I zoom in on the line.
Screenshots/Video With 50,000 data points

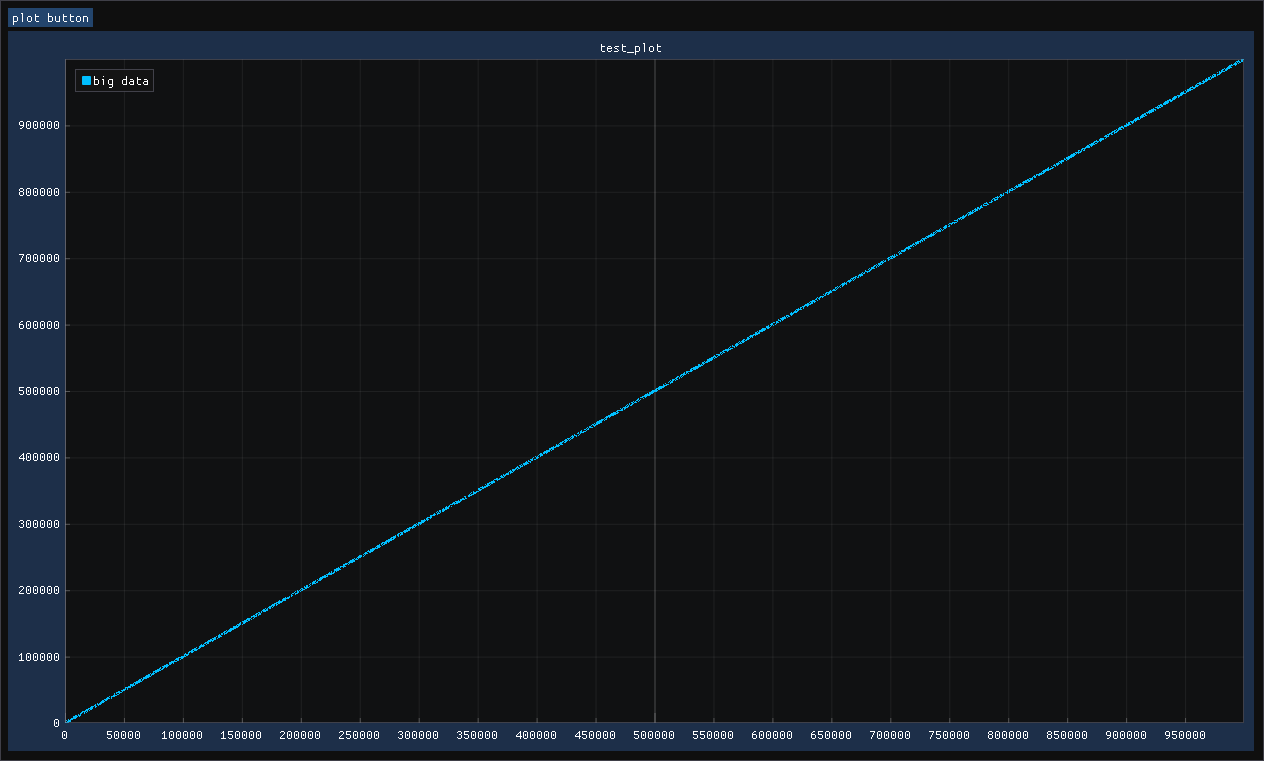
With 1,000,000 data points
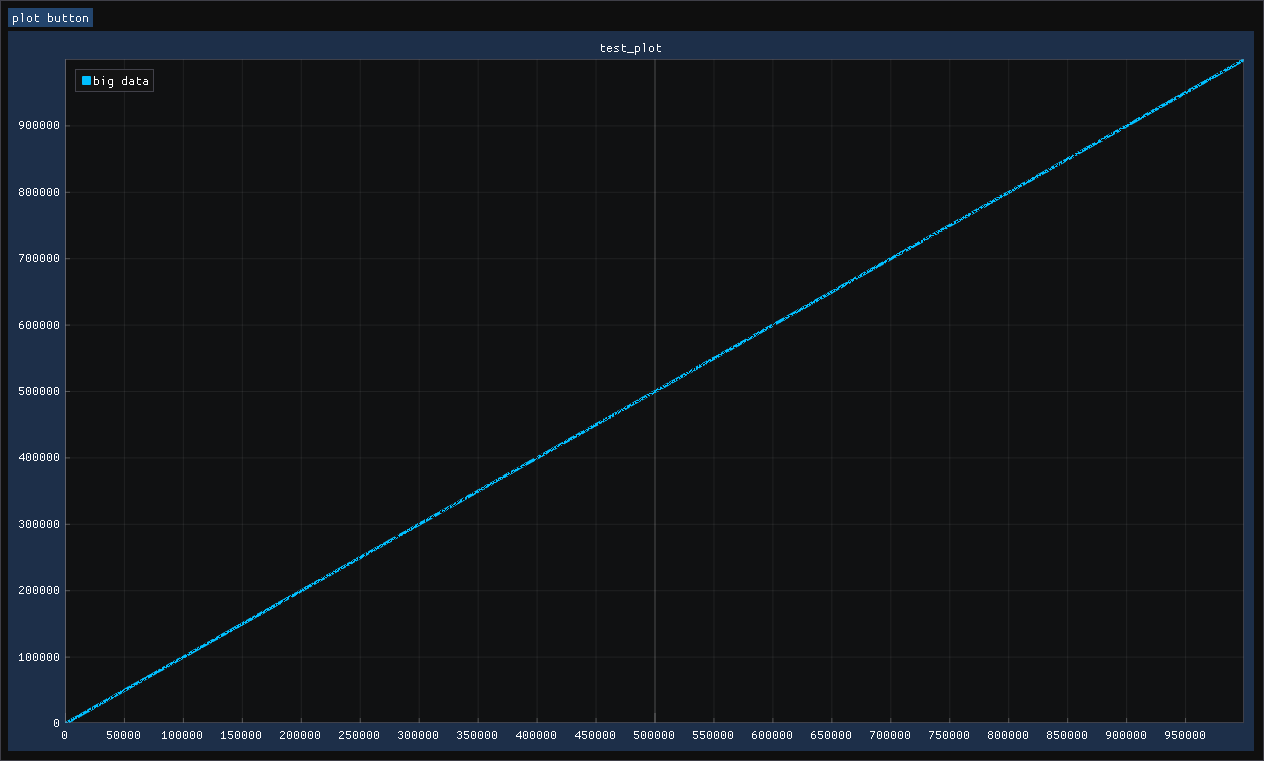
With 1,000,000 data points and anti-aliasing turned off
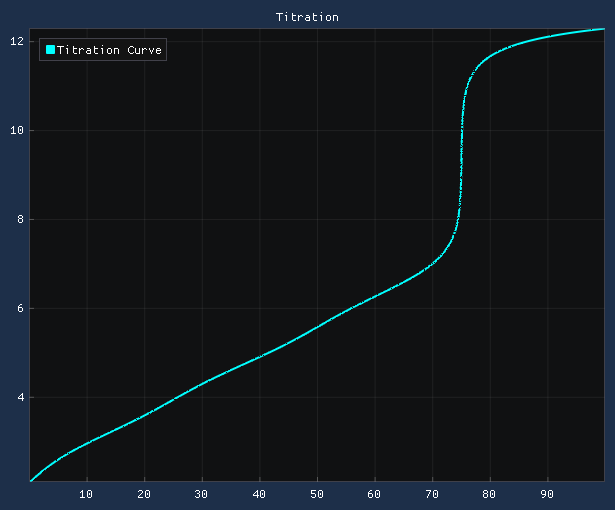
More complex plot with 140,000 data points
Standalone, minimal, complete and verifiable example:
from dearpygui.core import *
from dearpygui.simple import *


def callback(sender, data):
    x = list(range(0, 1_000_000))
    y = list(range(0, 1_000_000))
    add_line_series("test_plot", name="big data", x=x, y=y, weight=3)


with window("Tutorial"):
    add_button("plot button", callback=callback)
    add_plot("test_plot", anti_aliased=True)

start_dearpygui(primary_window="Tutorial")
This appears to be an imgui/implot bug... but I have a fix that we can add in the next release.
I've done some quick test and basically the solution I've come up with is to add flags to allow users to down sample the data based on how many pixels wide the plot is. Basically it makes no sense to actually try to render 1 million points if a plot is only 100 pixels wide.
So the next release will have something like this:
add_line_series("test_plot", name="big data", x=x, y=y, down_sample=True)
We plan on having the plotting backend revamped for 1.7 (similar to how we just did the node backend for 1.6). This would include a fix for this issue!
Is there any plan on integrating the automated down sampling in lines and scatters? This would increase performance on big data sets. I havent found anything regarding that.