Provide programmatic access to plot legends' unique ability to show/hide series
Is your feature request related to a problem? Please describe. There is inconsistent behavior between toggling a series of a plot on/off by clicking its color in the legend and using the hide_item()/show_item() functions. Clicking the legend causes the plot to stop displaying the series and greys out its label in the legend. It can be shown by clicking its label again. Hiding the series by calling hide_item(series) removes it from the plot AND the legend. It can only be returned by calling "show_item(series)".
Additionally, there is no programmatic way to check if a series is being hidden by the legend (its "show" parameter will still equal True) or to cause this effect without clicking.
Describe the solution you'd like I would prefer that the legend behavior be the default behavior of show_item() and hide_item() as applied to a series. This would make it possible to check and control programmatically without introducing new functions or properties of series.
Describe alternatives you've considered For consistency, the current behavior of show_item() and hide_item() applied to a series can remain in order to remove them from the plot and legend without destroying them. A new property or new function would be added to give programmatic checking and control of the special behavior seen when hiding a series using the legend.
Additional context
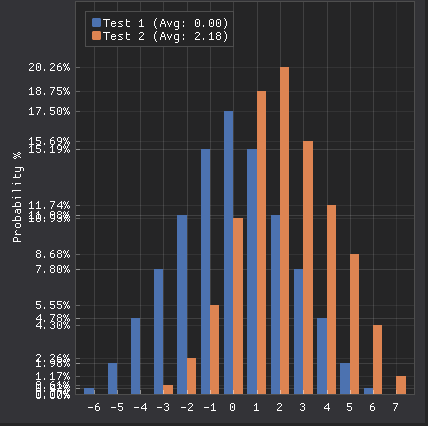
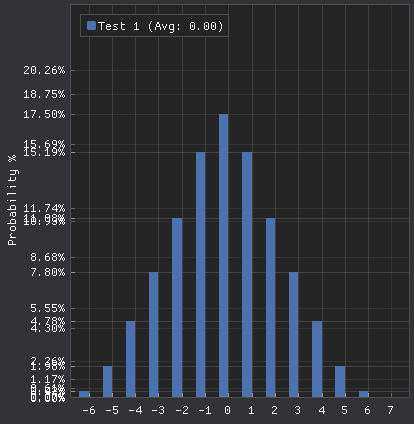
The following images illustrate the normal state of a two-series bar plot, its state when one series is hidden using the legend, and its state when one series is hidden by calling hide_item() using the series ID:

Has this been added?
the same question, is this feature added? or is there any other work-around to get the status of a series is shown or hidden?
Not yet, but you can implement a custom legend and then use is_item_shown to query the status of a series. Here is an example, feel free to use under MIT license:
#!/usr/local/bin/python3

from math import pi, sin
import dearpygui.dearpygui as dpg

dpg.create_context()
dpg.create_viewport(title=f"Test - {dpg.get_dearpygui_version()}", width=700, height=700)

def deferred_init():
    # We need this to run after frame 1 or even frame 2 in order for dpg.get_text_size to work
    with dpg.window():
        dpg.set_primary_window(dpg.last_item(), True)

        x_data = [x/10 - 2*pi for x in range(0, int(4*pi*10))]
        y_data = [3*sin(x) for x in x_data]

        # We're using a 0-spacing horizontal group + indent on its children in order
        # to overlay a child window on top of the plot.  An alternative would be to
        # specify `pos` on child_window, but if plot position changes, child_window
        # position will also need to be updated.  The group+indent solution does that
        # automatically.
        with dpg.group(horizontal=True, horizontal_spacing=0):
            with dpg.plot(label="Regular plot", width=-1, height=-1):
                dpg.add_plot_legend(location=dpg.mvPlot_Location_NorthEast)
                dpg.add_plot_axis(dpg.mvXAxis, label="x")
                with dpg.plot_axis(dpg.mvYAxis, label="y") as y_axis:
                    dpg.add_shade_series(x_data, y_data, label="Shade series")
                    dpg.add_line_series(y_data, x_data, label="Line series")
                    dpg.add_scatter_series(y_data, x_data, label="Scatter series")
                    dpg.add_scatter_series(y_data, x_data, label="Scatter series")
                    dpg.add_scatter_series(y_data, x_data, label="Scatter series")
                    dpg.add_scatter_series(y_data, x_data, label="Scatter series")

            with dpg.group(indent=60):
                OUTER_PADDING = 6
                SQUARE_SPACING = 2

                font_height = dpg.get_text_size("")[1]
                square_size = int(font_height * 0.7)
                square_y_offset = (font_height - square_size + 1) // 2

                plot_items = dpg.get_item_children(y_axis, slot=1)
                total_height = len(plot_items) * font_height + 2*OUTER_PADDING
                total_width = max([dpg.get_text_size(dpg.get_item_label(item))[0] for item in plot_items])
                total_width += square_size + SQUARE_SPACING + 2*OUTER_PADDING

                with dpg.theme() as legend_theme:
                    with dpg.theme_component(dpg.mvAll):
                        dpg.add_theme_style(dpg.mvStyleVar_ItemSpacing, 4, 0)
                        dpg.add_theme_style(dpg.mvStyleVar_CellPadding, OUTER_PADDING, OUTER_PADDING)

                GRAYED_COLOR = (128, 128, 128, 255)
                with dpg.theme() as grayed_theme:
                    with dpg.theme_component(dpg.mvAll):
                        dpg.add_theme_color(dpg.mvThemeCol_Text, GRAYED_COLOR)

                def on_item_clicked(sender, app_data, user_data):
                    item, color, entry_container, square_id = user_data
                    show = not dpg.is_item_shown(item)
                    dpg.configure_item(item, show=show)
                    dpg.configure_item(square_id, fill=color if show else GRAYED_COLOR)
                    dpg.bind_item_theme(entry_container, 0 if show else grayed_theme)

                dpg.add_spacer(height=20 + font_height)     # don't add font_height if the plot has no label
                with dpg.child_window(width=total_width, height=total_height, border=False):
                    dpg.bind_item_theme(dpg.last_item(), legend_theme)

                    with dpg.table(row_background=True, header_row=False, borders_outerH=True, borders_outerV=True) as table:
                        dpg.add_table_column()
                        with dpg.table_row():
                            with dpg.group():
                                for i, item in enumerate(plot_items):
                                    with dpg.group(horizontal=True, horizontal_spacing=SQUARE_SPACING) as entry_container:
                                        color = dpg.get_colormap_color(dpg.mvPlotColormap_Default, i)
                                        color = [c*255 for c in color]
                                        square_id = dpg.generate_uuid()
                                        user_data = (item, color, entry_container, square_id)
                                        with dpg.drawlist(square_size, font_height, callback=on_item_clicked, user_data=user_data):
                                            dpg.draw_rectangle((0, square_y_offset), (square_size, square_size + square_y_offset), fill=color, color=(0, 0, 0, 0), rounding=1, tag=square_id)
                                        dpg.add_selectable(label=dpg.get_item_label(item), span_columns=True, callback=on_item_clicked, user_data=user_data)

                    dpg.set_table_row_color(table, 0, (37, 37, 38, 255))


dpg.set_frame_callback(2, callback=deferred_init)

dpg.setup_dearpygui()
dpg.show_viewport()
dpg.start_dearpygui()
dpg.destroy_context()
The legend on the right side is the built-in ImPlot legend, where the visibility is stored somewhere inside ImPlot and can't be retrieved from within DPG. The legend on the left is actually a table that uses a drawlist and add_selectable to display each entry.
This script was developed for a pre-2.0 version of DPG. Starting with DPG 2.0, there's no need to use a table, I bet you can put selectables right into the child_window, and the child window itself will provide correct borders (you can see that borders on the right and bottom side are missing). Use auto_resize_x/y if necessary.