Visual help
i am sorry to trouble you . i want to knew how to get the predict result like this
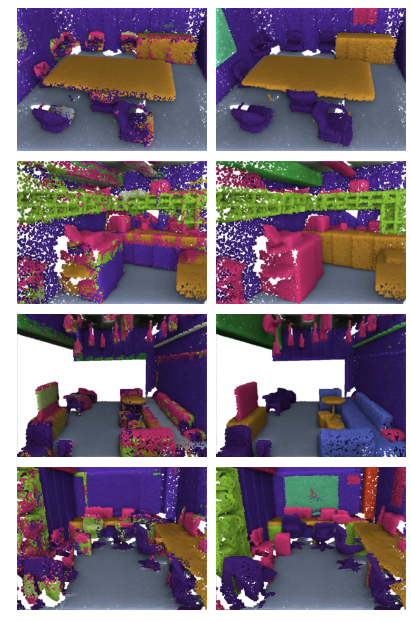
To produce this visualization, you need to predict the labels of each block of the scene, and use the global coordinates stored in each point and put all the points from all blocks together. Save them all to a ply.
Each point's label you can save an RGB that marks the color of that label.
Finally, use Meshlab to open the ply file, and set the point size large enough.
I myself use an internal tool to visualize the ply file though but Meshlab should work just fine.
2019年9月3日(火) 10:27 clin-fu [email protected]:
i am sorry to trouble you . i want to knew how to get the predict result like this [image: image] https://user-images.githubusercontent.com/46855430/64137835-f83ad980-ce2c-11e9-945c-54924beb776d.png
— You are receiving this because you are subscribed to this thread. Reply to this email directly, view it on GitHub https://github.com/hkust-vgd/pointwise/issues/19?email_source=notifications&email_token=AABBPMTM6JZ7FUPXC3DODTTQHW4PDA5CNFSM4ITBBXP2YY3PNVWWK3TUL52HS4DFUVEXG43VMWVGG33NNVSW45C7NFSM4HI3VD2A, or mute the thread https://github.com/notifications/unsubscribe-auth/AABBPMQQYWOGRXHQYZURKS3QHW4PDANCNFSM4ITBBXPQ .
thank you for your reply. in your code it just output the accurancy (pointwise predict).i can not recurrence the visualization results to help me understand better.could you please suggest me some code to solve this problem .