highcharts-angular
 highcharts-angular copied to clipboard
Updating Node Sizing in Network Graph (and Handling Data/Node Updates Effectively)
Describe the bug
Recently, I've been exploring the Network Graph chart as a means to display some fairly simple sets of data (typically a single root node and n leaf nodes that come off of the root, where n < 10) that looks something like the following:
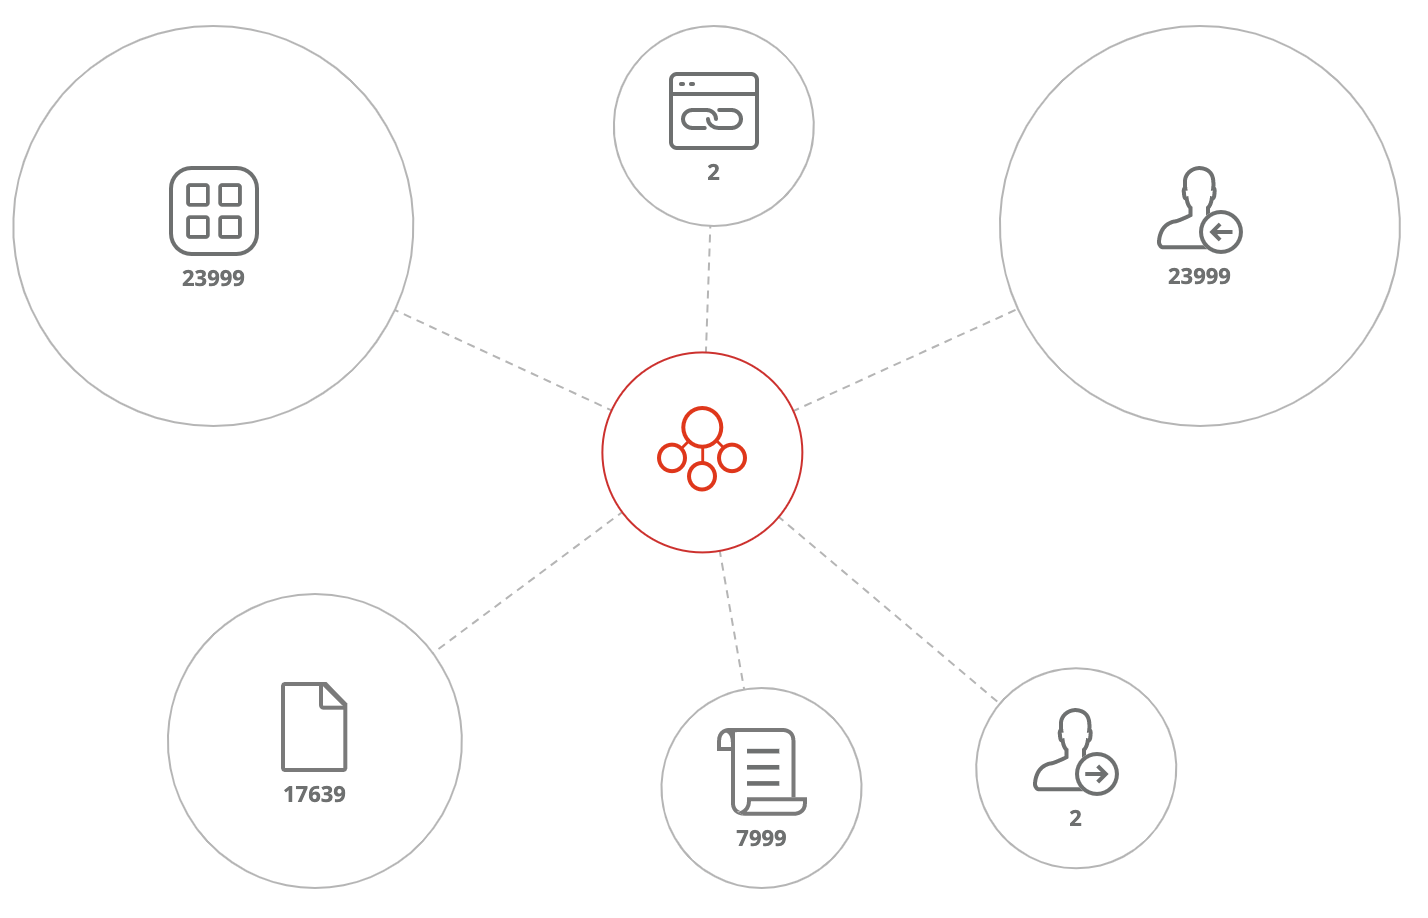
This chart generally flows as follows:
- Receive data from a REST endpoint containing all of the information about the nodes
- Parse the response from the endpoint into objects that are used to populate the series data.
- Construct the nodes based off the data (always construct the base node and then based on the data, build the leaf nodes).
The issue here are that the size of the leaf nodes will be relative to the values that come back from the endpoint, but performing an update does not change the sizes of the nodes at all (e.g. changing the marker.radius for each node doesn't have an effect when the chart is updated).
What's the best way to handle these types of updates/changes? The demo I'm including is a very simplified example, but I'd expect my nodes to each have custom/updated dataLabels as well as click events based on the response from the endpoint.
Can this be done through the chartOptions of the wrapper? Or would I need to capture the underlying chart reference (e.g. chartRef via the chartCallback) to perform the update?
Expected behavior
I'd expect that when the nodes of a given series are updated that the marker.radius values for each of the nodes would change, however they appear to stay the same. I'd also expect other node properties such as the dataLabels, event handlers (e.g. click events), etc. to be updated as well.
Demo
You can see a demo here that attempts to update the data and nodes and while some of the nodes are removed that are not present in the set, the nodes themselves remain the same size.
Hi @rionmonster!
In order to set the node size, you have to first declare the nodes and then use the marker radius property as shown in the demo.
I think in this case, there is no need to get the reference to the char. Updating the chart through the chartOptions should be enough.
Hi @karolkolodziej
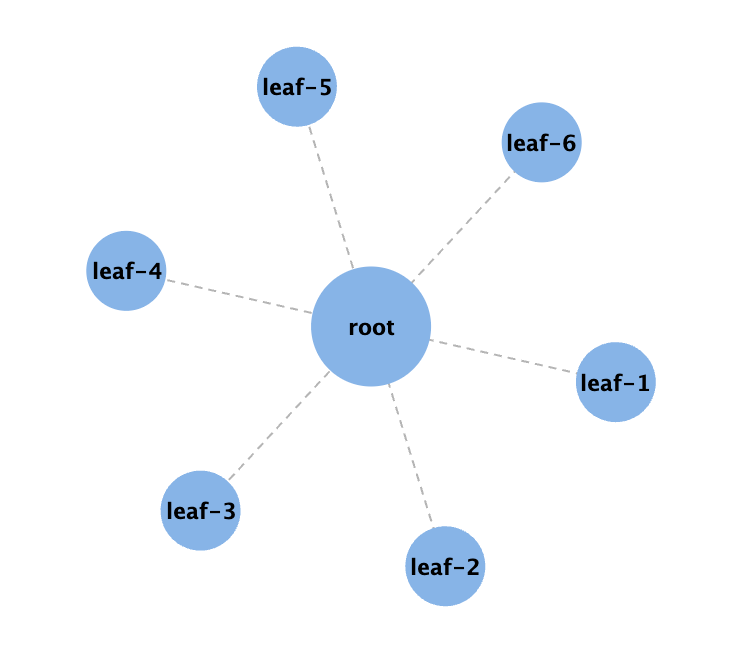
Thanks for the response. I can see that the initial declaration of the nodes within the chart affect the sizes of each of the nodes as you'd expect:
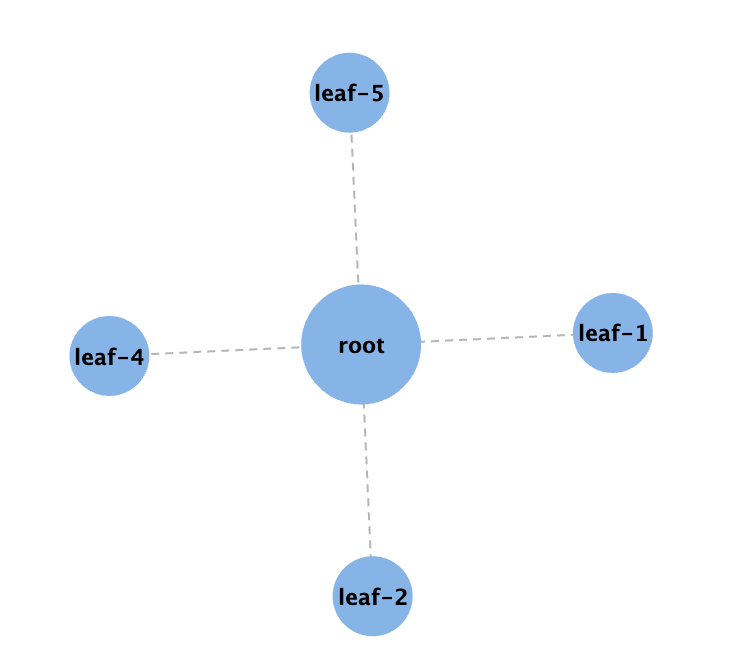
However, after clicking the "Update" button that appears at the bottom, each of the nodes should be updated based on the new data set that comes in:
// Updates data and nodes
handleUpdate() {
    var updatedData = this.getUpdatedData();
    var updatedNodes = this.convertDataToNodes(updatedData);
    console.log(updatedData);

    this.chartOptions.series[0] = {
      type: 'networkgraph',
      data: updatedData,
      nodes: updatedNodes,
    };

    this.updateFlag = true;
}

// Generates new data
private getUpdatedData(): any[] {
    return [
      { from: 'root', to: 'leaf-1', count: 4 },
      { from: 'root', to: 'leaf-2', count: 5 },
      { from: 'root', to: 'leaf-4', count: 2 },
      { from: 'root', to: 'leaf-5', count: 2 },
    ];
}

// Use the current data set to generate the nodes
private convertDataToNodes(data: any[]): any[] {
    var nodes = [];

    // Always set the base node
    nodes.push({
      id: `root`,
      marker: {
        radius: 50,
        fillColor: '#FFF',
        lineWidth: 1,
        lineColor: 'red',
      }
    });

    // For each data node, update it and include sizing based on count
    data.forEach((d) => {
      nodes.push({
        id: `${d.to}`,
        marker: {
          radius: d.count * 10,
        },
      });
    });

    return nodes;
}
You can see that after the update, the graph is updated, however the nodes that were updated don't seem to reflect any of the changes in sizing (the only difference is that the data points that were removed in the update are not displayed):
It doesn't seem like changing the series data/nodes is sufficient to change the sizing of the nodes, at least not within the demo here. Do I need to pick up on some event for the chart/series and explicitly update the sizing? Just trying to determine the best way to accomplish this since my use-case will have pretty frequent updates involving sizing and labels.
From what I can see it is a more general Highcharts issue not related to how the wrapper works- demo. As you can see in the demo you are only allowed to update certain nodes, one by one.
At that point, I think you should create a chart reference and update each node as I did in the JS demo.