v4r-plot
 v4r-plot copied to clipboard
Published
4 years ago
•
 hibetterheyj
For a better scientific drawing pipeline in MATLAB 😀 or Python
v4r-plot
For better scientific plotting pipeline 😀
At a glance
Python (2021.05 updated!)
:bulb: visualize the notebook directly in nbviewer !
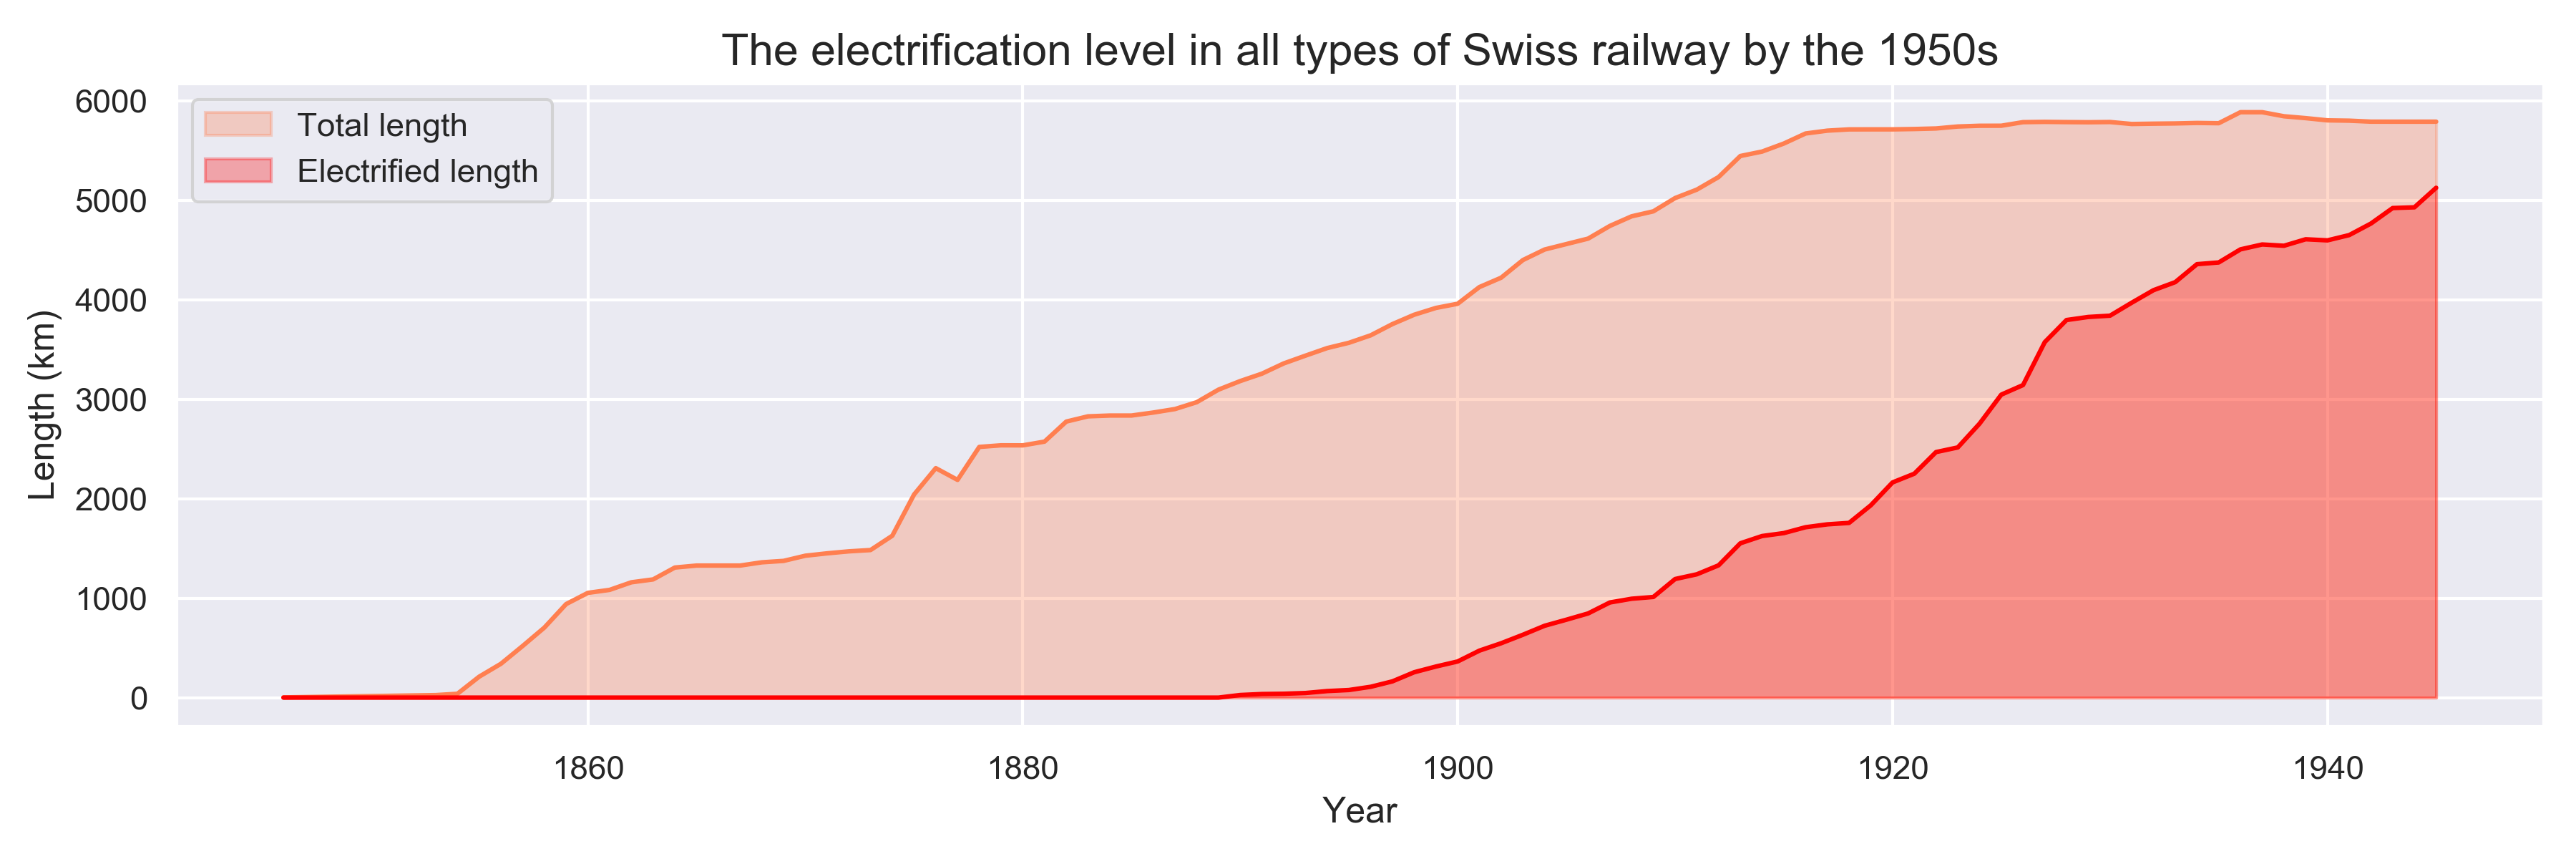
line & area chart
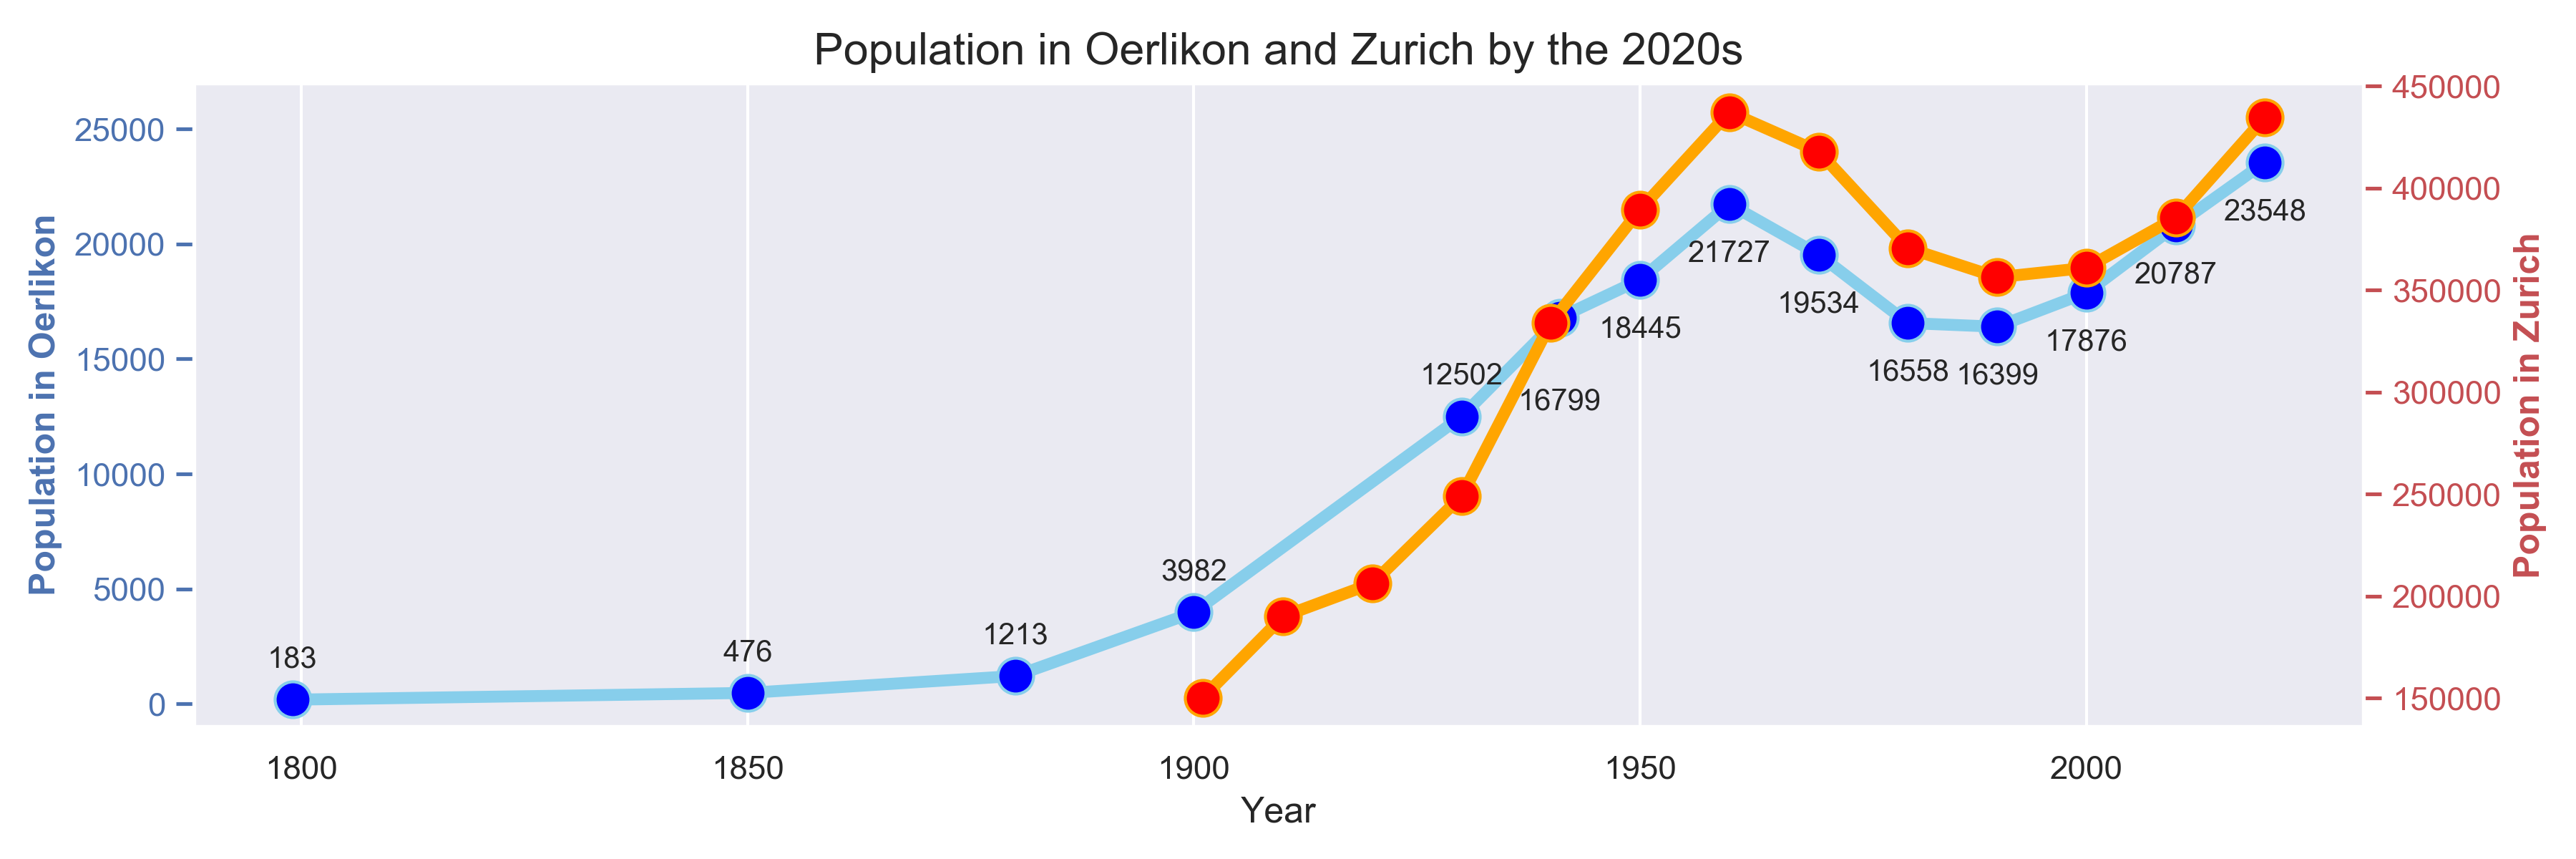
double-y line chart
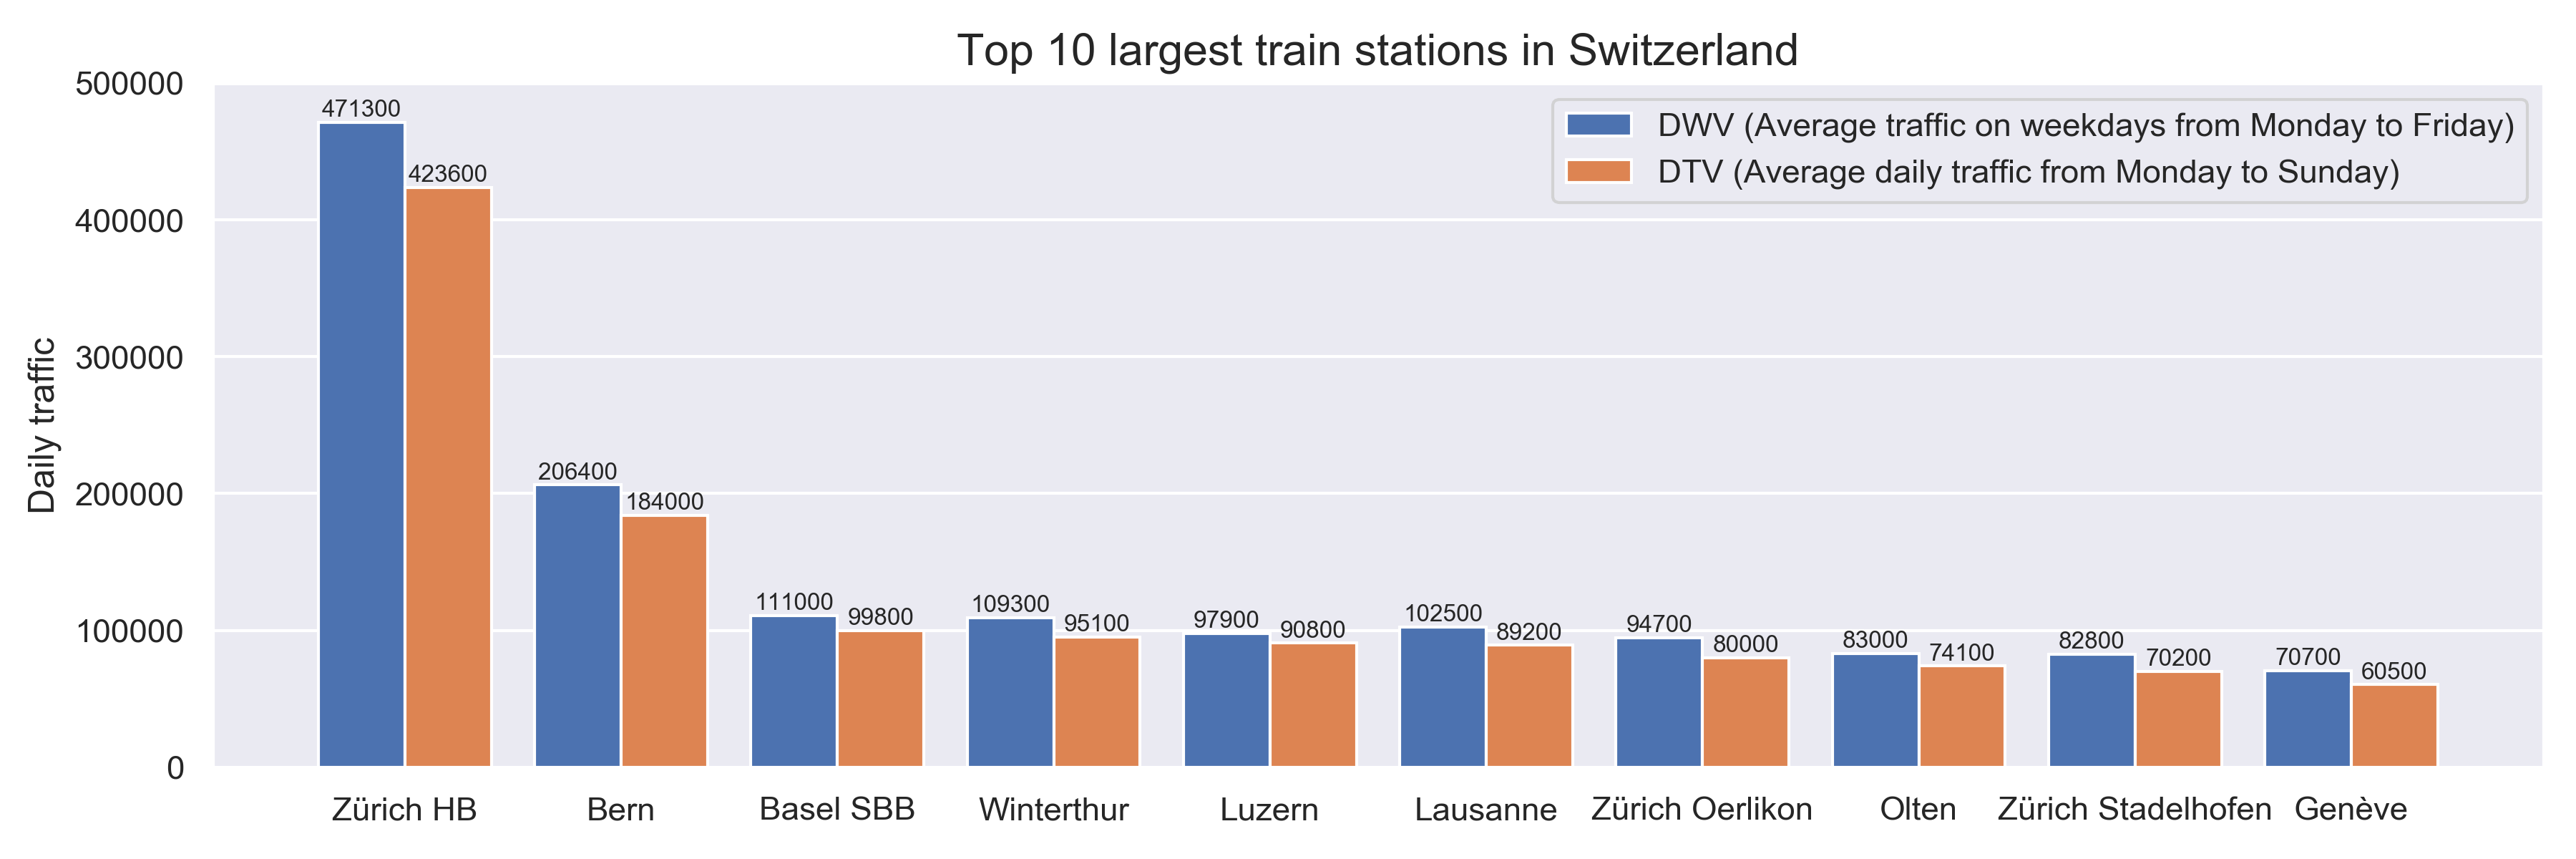
bar plot
Matlab
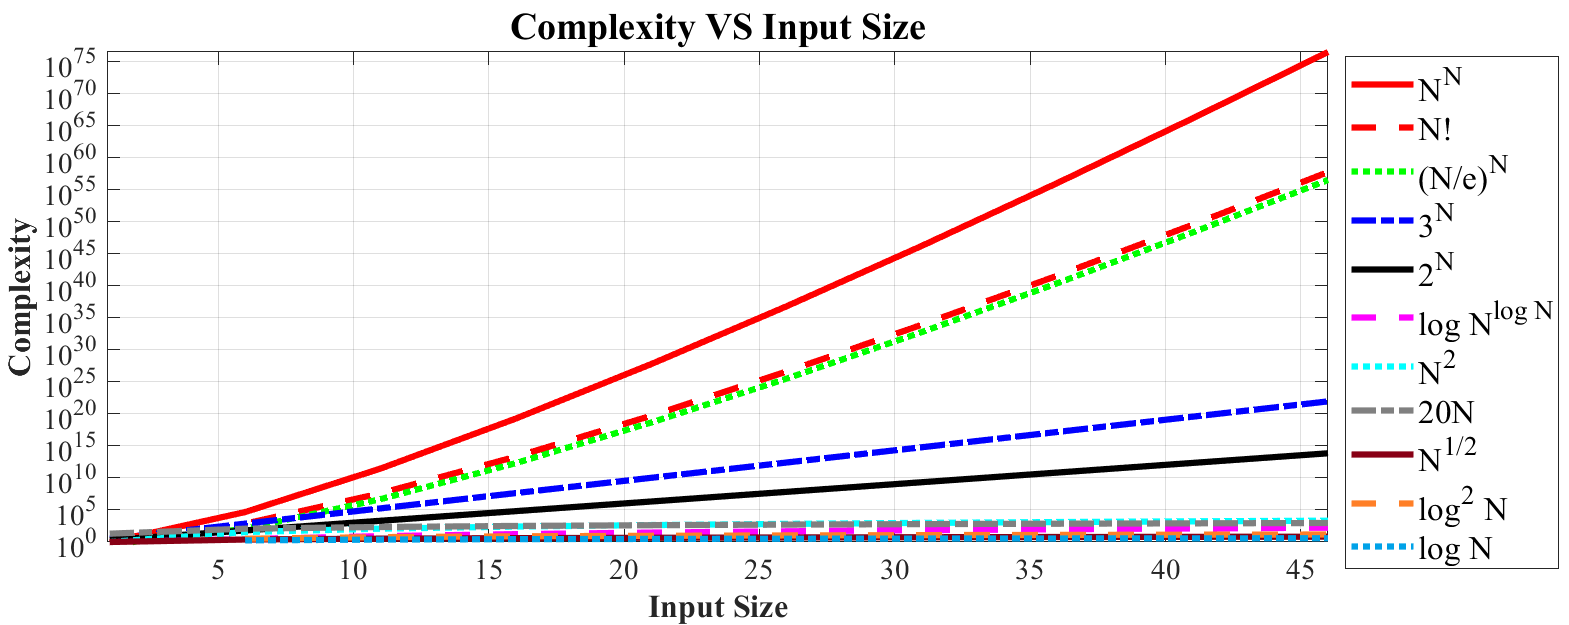
算法复杂度曲线
折线图-跟踪过程指标变化
折线图-图中图
星星图-跟踪性能/运行速度图
柱状图-两个y轴不同跟踪性能
%E5%88%86%E6%9E%90/yyaxis_bar_plot.png)
Detailed scripts
Python
- [ ] 基本指令(画图,字体设置,字体大小,坐标轴字体,图片导出设置与Office系列的联动)
- [ ] 折线堆积图+透明度
- [ ] SLAM场景output/gt比较图
Matlab
Yujie-plot
- [x] 折线与条形图(20200429,v1)
- [x] 折线图-跟踪过程CLE变化图(20200416,v2)
- [x] 星星图
- [x] 普通版本(20200330,v2)
- [x] Log版(20200417,v2)
- [x] 图中图(20200313,v1)
- [x] 棒棒糖图
- [x] 多角度响应图
- [x] 折线图-不同指标(20200415,v1)
- [x] 折线图-参数分析
- [x] 添加额外垂直线,强调顶点(20200417,v1)
- [x] 水平与垂直折线(20200416,v2)
- [x] 柱状图
- [x] 多bar(20200406,v1)
- [x] 单bar(20200415,v1)
- [x] 左右轴多bar(20200426,v1)
- [x] 其他
- 数据集尺度分析
- 数据集挑战因素分析
- [x] 算法复杂度曲线|ComplexityPlot(20201004,v1)
Fuling-plot
- [x] TB-BiCF柱状图!(20200416,v1)
Van-plot
TODO
参考 | Reference
Python
- Matplotlib gallery: https://matplotlib.org/3.3.1/gallery/index.html
- vacancy/Jacinle: MIT前辈个人代码库(python)
- Python 和数据科学笔记
Matlab
-
altmany/export_fig: A MATLAB toolbox for exporting publication quality figures
-
Matlab用户需要一张画图速查表 | Matlab Plot Cheatsheet
Metadata
15
Stars
2
Forks
15
Watchers
Owner
Metadata
For a better scientific drawing pipeline in MATLAB 😀 or Python