nomad
 nomad copied to clipboard
Multiple concurrent job submission causes CPU oversubscription
Nomad version
Nomad v1.2.6 (a6c6b475db5073e33885377b4a5c733e1161020c)
Operating system and Environment details
Ubuntu 20.04
Issue
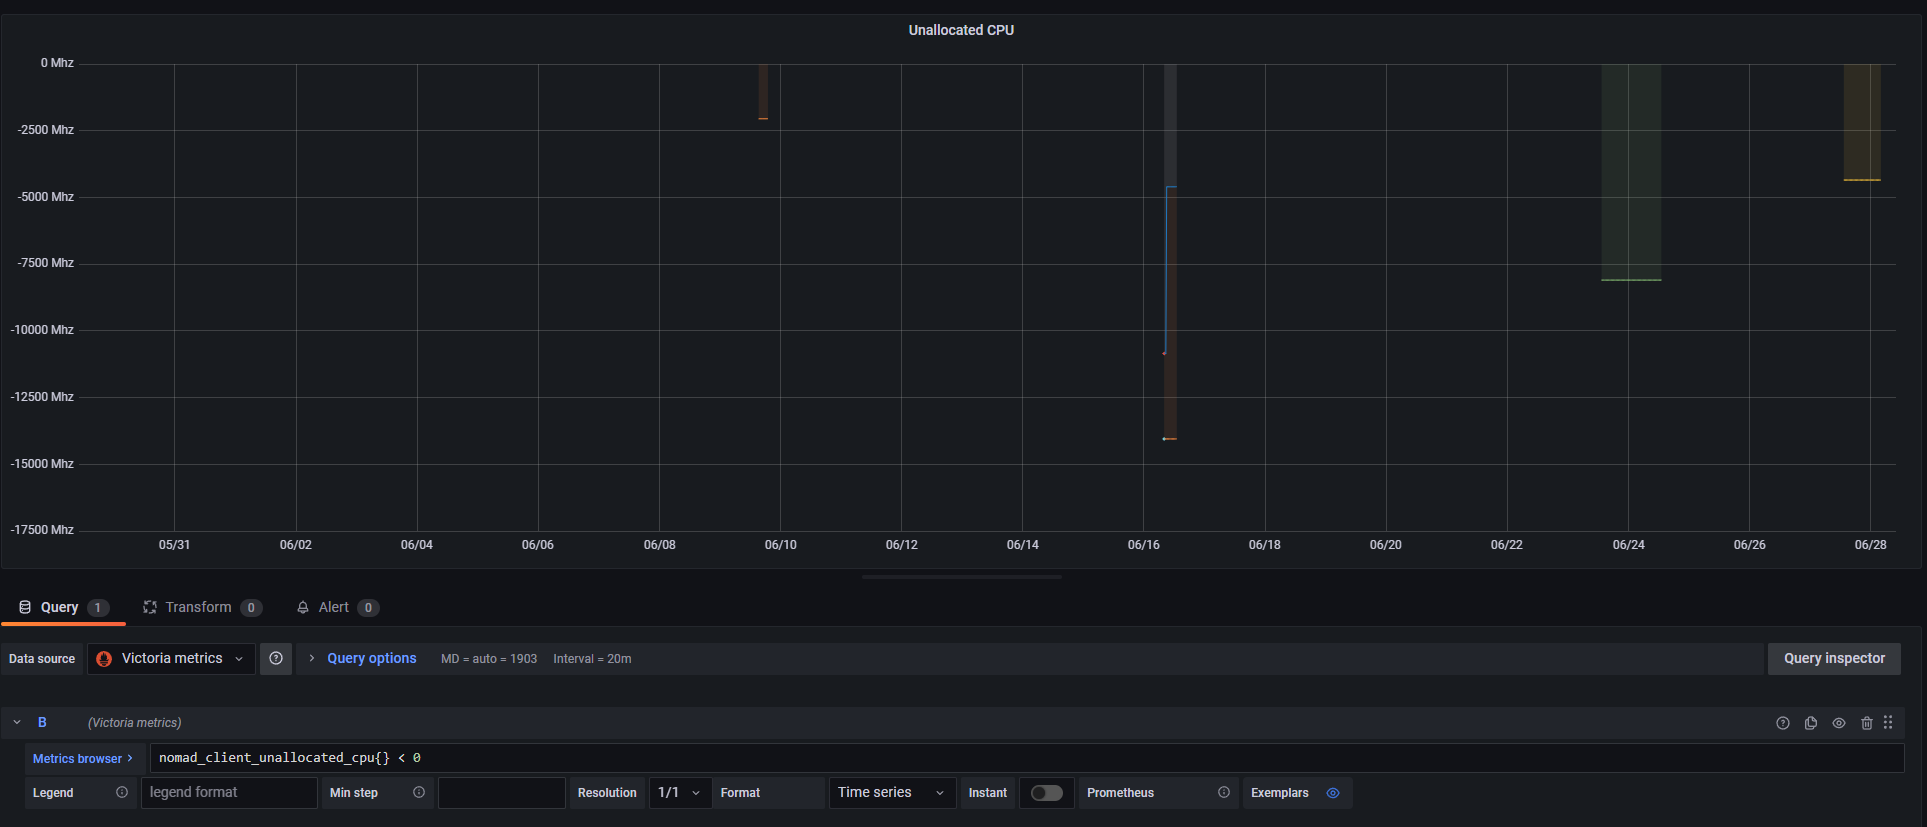
We've noticied that nodes in our cluster sometimes report oversubscription of CPU, or rather a negative value of unallocated CPU.
The value shown in the graph below is the raw value from the gauge nomad_client_unallocated_cpu.

We can also see this in the Nomad Topology view, where the bar for allocated CPU is overflowing the container:

Reproduction steps
We've only managed to observe this behavior when we start multiple jobs in a very short time (read milliseconds).
Leading us to believe that this is some kind of timing issue, where the calculation of available resources isn't able to take all the new allocations into account.
Expected Result
We never expect a node to report a negative value for unallocated CPU.
Actual Result
Multiple nodes in our cluster report negative values for unallocated CPU.
Job file (if appropriate)
Nomad Server logs (if appropriate)
Nomad Client logs (if appropriate)
Hi @ostkrok, can you describe your environment a little more? Another possibility here could be that the CPU fingerprint changes over time, if its reported frequency fluctuates.
e.g.
nomad node status -self -verbose | grep cpu\.
Hi @shoenig,
I'd be happy to describe it a bit more, but I'm not really sure what you want to know :) Could you tell me if there is anything specific you want me to describe?
I don't think that the CPU fingerprint changes for us. It's a physical server using the performance CPU govenor, and we've never seen it report anything other than 88 000 Mhz.
> nomad node status -self -verbose | grep cpu\.
cpu.frequency                    = 3700
cpu.totalcompute                 = 88800
Here's a graph showing nomad_client_allocated_cpu + nomad_client_unallocated_cpu, which seem to always stay at 88 300 Mhz.
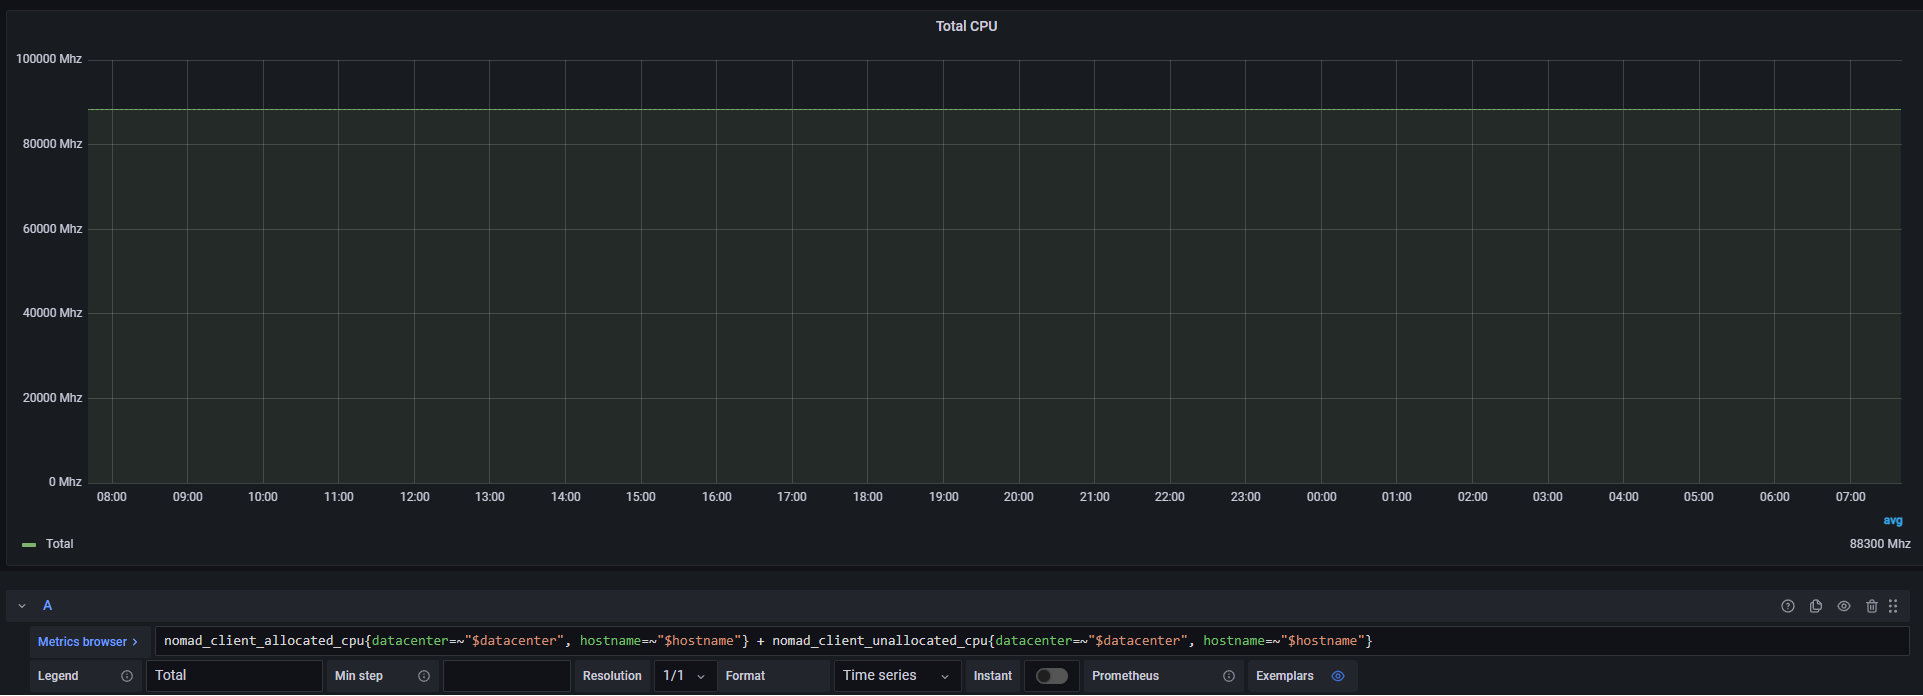
I'm guessing that the difference of 500 Mhz is related to us setting this in our Nomad config:
client {
    reserved {
        cpu = 500
    }
}
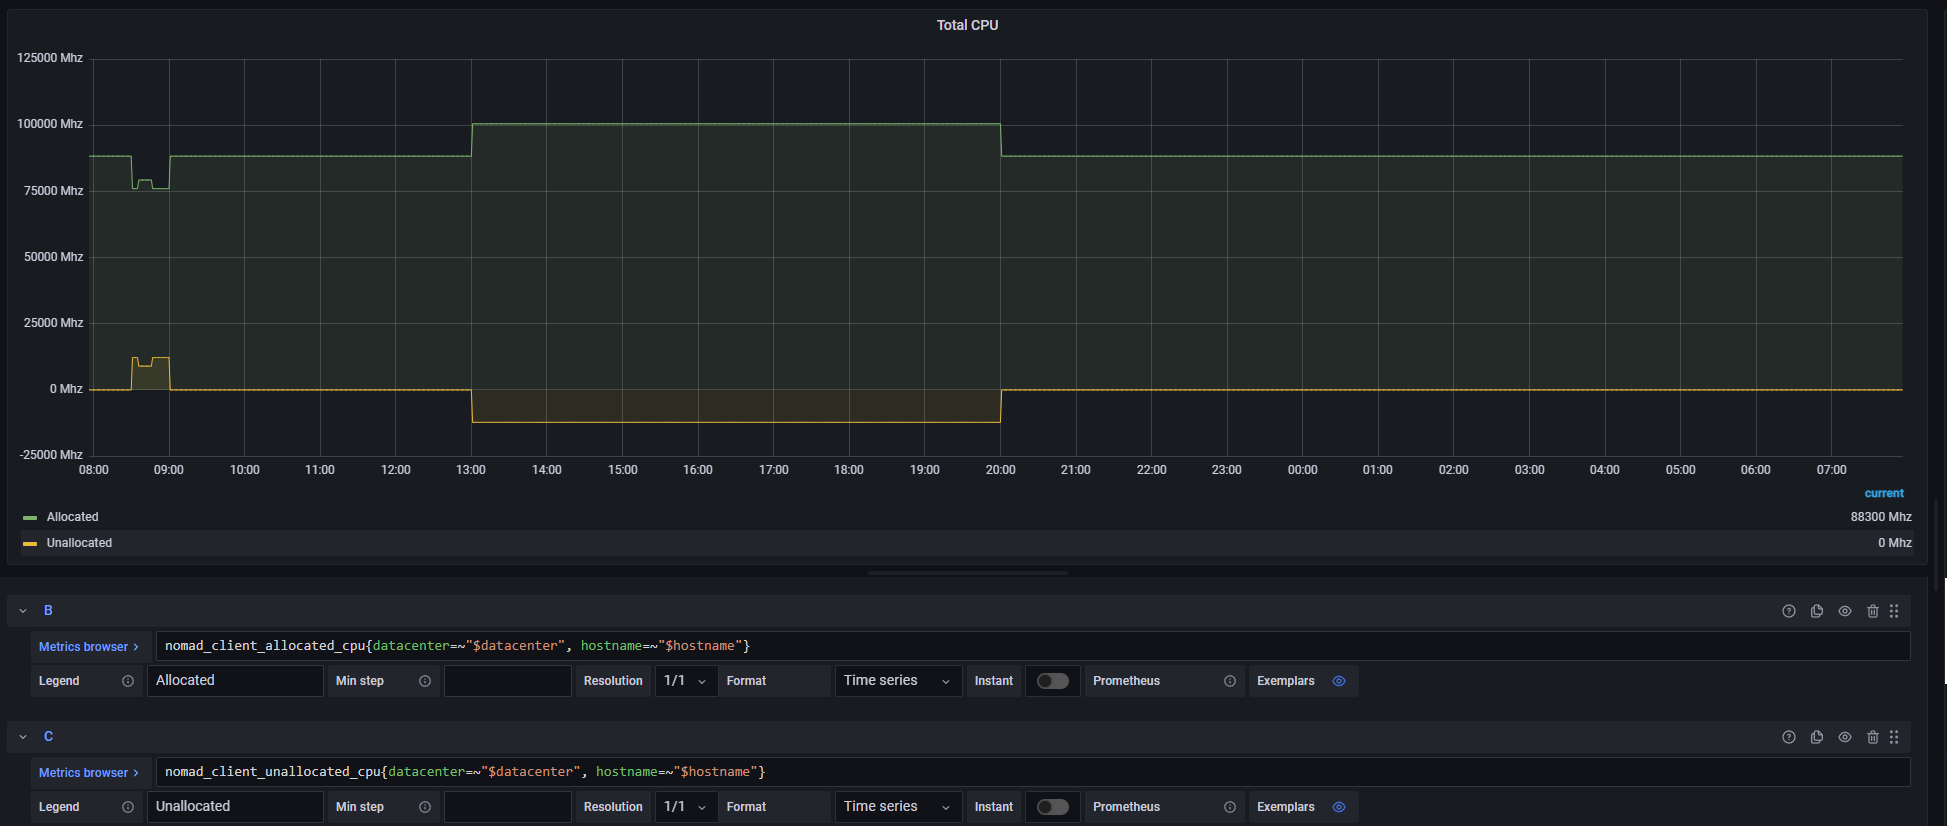
And here's a graph showing both metrics individually:
Hi @shoenig,
Just checking back to see if there is any additional information we can provide that would help you in identifying the cause of this issue?
@ostkrok you mentioned:
We've only managed to observe this behavior when we start multiple jobs in a very short time (read milliseconds).
It might be helpful to look at whether the overlapping amount is from allocations that are currently in the process of shutting down to be replaced by other allocations that are currently being placed (either from that job or another one run at the same time). I checked the code at client/client.go#L2986 where this measurement is being taken, and it looks like if you had allocations that were migrated during updates you could almost certainly see this during the migration process.
Hi again @tgross. Sorry for not getting back sooner.
It might be helpful to look at whether the overlapping amount is from allocations that are currently in the process of shutting down to be replaced by other allocations that are currently being placed (either from that job or another one run at the same time). I checked the code at
client/client.go#L2986where this measurement is being taken, and it looks like if you had allocations that were migrated during updates you could almost certainly see this during the migration process.
If this is the cause of our issue, wouldn't you think that the duration of the oversubscription would be shorter?
When we observe this behavior, the oversubscription persists until we manually stop jobs on the Nomad client. In the screenshot above you can see that one of our nodes was oversubscribed for around 7 hours.
Hi again,
I just wanted to follow up with some more information regarding this.
Nomad 1.3.1
We initially noticed the problem with Nomad v1.2.6 (a6c6b475db5073e33885377b4a5c733e1161020c), but we've since updated to Nomad v1.3.1 (2b054e38e91af964d1235faa98c286ca3f527e56), and we're still seeing this issue.
Job Creation
I also want to add that we're creating these jobs via the API, if that helps to narrow down what could be causing the issue.
If this is the cause of our issue, wouldn't you think that the duration of the oversubscription would be shorter?
When we observe this behavior, the oversubscription persists until we manually stop jobs on the Nomad client. In the screenshot above you can see that one of our nodes was oversubscribed for around 7 hours.
Ah yes, good point. I'm looking through the section of the client code (ref client.go#L2967-L2990) where this gets set and something that jumps out at me is that if we have allocations that are terminal on the server but not the client, they don't get counted towards the usage. Any chance you have any allocations that are currently stuck in pending on the client?
Ah yes, good point. I'm looking through the section of the client code (ref
client.go#L2967-L2990) where this gets set and something that jumps out at me is that if we have allocations that are terminal on the server but not the client, they don't get counted towards the usage. Any chance you have any allocations that are currently stuck in pending on the client?
As I mentioned we sometimes start a large amount of jobs (sometimes 10 or more) within 100 ms of each other. So I guess they start out pending? But they quite quickly move on to running, and stay running for several hours.
And just to check, do you think this is only a problem with the emitted metrics? Because we think it's more of a scheduling issue. I'm not really sure how Nomad is supposed to work in these conditions, but let me give you an example of how we think Nomad is supposed to work.
Let's say that we have a single node with 1000 CPU, and nothing reserved. We then start 15 jobs, each requiring 100 CPU, at the same time (let's say during 1 millisecond for this example).
What we expect to happen here is that Nomad will realize that scheduling all these on the one node would result in the node becoming overcommitted, and thereby only schedule 10 of the jobs on that node. Is this a correct assumption? Because what we observe makes it seem that Nomad doesn't correctly take this into account when multiple jobs are started within a very short timeframe.
What we expect to happen here is that Nomad will realize that scheduling all these on the one node would result in the node becoming overcommitted, and thereby only schedule 10 of the jobs on that node. Is this a correct assumption?
That's correct. Nomad has an optimistically concurrent scheduler where each Evaluation is scheduled concurrently across the servers, but then the evaluation results in a Plan that's submitted to the Plan Applier that runs on the leader. This Plan Applier serializes the evaluations so that only allocations that fit are placed, and it rejects plans that don't fit to send back to the scheduler worker. (See Scheduling for more details on this.)
And just to check, do you think this is only a problem with the emitted metrics? Because we think it's more of a scheduling issue.
The reason I was focused on metrics was that's what you were presenting, so I guess I'm trying to figure out at this point whether you actually have overlapping allocations that you shouldn't. You should be able to determine this by looking at the nomad job status :job_id output and then finding the allocations on a given node via nomad node status -verbose (there's a list of allocs at the bottom).
I'm not saying it's impossible for there to be a bug in the optimistic scheduling, but the bits of code that do the serialization step are all pretty old and I'd have expected this kind of thing to pop up before. Any chance you're scheduling via cores and not cpu? (That's newer fit check.) It might help to have a job spec here as well.
Thanks for taking the time to follow up @tgross.
Any chance you're scheduling via cores and not cpu? (That's newer fit check.) It might help to have a job spec here as well.
No, we're currently only using cpu.
The reason I was focused on metrics was that's what you were presenting, so I guess I'm trying to figure out at this point whether you actually have overlapping allocations that you shouldn't. You should be able to determine this by looking at the nomad job status :job_id output and then finding the allocations on a given node via nomad node status -verbose (there's a list of allocs at the bottom).
On our end, we are pretty sure that we have overlapping allocations that we shouldn't, but I understand if you want to verify that :)
It's not just the metrics showing this oversubscription, but also the API. We have built a tool that uses the Nomad HTTP API to fetch all allocations for a node and sum up the allocated CPU. This tool also shows us the same data as the metrics, i.e. more CPU allocated than should be allowed.
Furthermore (as I wrote in the initial issue body) we also see this in the Nomad GUI under the topology view. Which makes sense as it uses the same HTTP API I guess?
I'll get back to you with the output of nomad node status -verbose the next time it happens.
Hi again @tgross,
We've now been able to collect output from nomad node status -verbose.
<redacted>@<redacted>:~$ nomad node status 65177d0c
ID              = 65177d0c-ccde-6077-2a1f-0f3fbc07b3ec
Name            = <redacted>
Class           = worker
DC              = <redacted>
Drain           = false
Eligibility     = eligible
Status          = ready
CSI Controllers = <none>
CSI Drivers     = <none>
Uptime          = 2810h11m22s
Host Volumes    = certs
Host Networks   = default,public
CSI Volumes     = <none>
Driver Status   = docker,exec

Allocated Resources
CPU                Memory         Disk
218800/209500 MHz  27 GiB/62 GiB  8.8 GiB/413 GiB

Allocation Resource Utilization
CPU               Memory
25705/209500 MHz  5.2 GiB/62 GiB

Host Resource Utilization
CPU               Memory         Disk
34507/210000 MHz  12 GiB/63 GiB  (/dev/mapper/ubuntu--vg-ubuntu--lv)

Allocations
ID        Node ID   Task Group    Version  Desired  Status    Created     Modified
948baeae  65177d0c  <redacted>    0        run      running   8m5s ago    7m46s ago
d15519d1  65177d0c  <redacted>    0        run      running   8m5s ago    7m43s ago
2dde4fd8  65177d0c  <redacted>    0        run      running   8m5s ago    7m44s ago
72630770  65177d0c  <redacted>    0        run      running   8m5s ago    7m46s ago
cfe25686  65177d0c  <redacted>    0        run      running   8m5s ago    7m43s ago
afd111fa  65177d0c  <redacted>    26       run      running   1h50m ago   1h50m ago
6e985152  65177d0c  <redacted>    0        run      running   23h8m ago   23h7m ago
bb4c9aa1  65177d0c  <redacted>    0        run      running   23h8m ago   23h7m ago
68013340  65177d0c  <redacted>    0        run      running   23h8m ago   23h7m ago
a79141bd  65177d0c  <redacted>    0        run      running   23h8m ago   23h8m ago
047d6cb7  65177d0c  <redacted>    0        run      running   7d4h ago    7d4h ago
4eb0b94a  65177d0c  <redacted>    2        run      running   8d22h ago   8d22h ago
505719a9  65177d0c  <redacted>    2        run      running   8d22h ago   8d22h ago
69a2da54  65177d0c  <redacted>    2        run      running   10d15h ago  10d15h ago
93660f82  65177d0c  <redacted>    2        run      running   10d15h ago  10d15h ago
b66b30b6  65177d0c  <redacted>    2        run      running   10d15h ago  10d15h ago
c5fd2494  65177d0c  <redacted>    2        run      running   10d15h ago  10d15h ago
bf1eb1ae  65177d0c  <redacted>    2        run      running   10d15h ago  10d15h ago
cce7c580  65177d0c  <redacted>    2        run      running   10d15h ago  10d15h ago
d4fb31b1  65177d0c  <redacted>    1        run      running   10d15h ago  10d15h ago
f5ef6f26  65177d0c  <redacted>    2        run      running   10d15h ago  10d15h ago
88165c85  65177d0c  <redacted>    2        run      running   10d15h ago  10d15h ago
9c42df80  65177d0c  <redacted>    2        run      running   10d15h ago  10d15h ago
b32401ae  65177d0c  <redacted>    1        run      running   14d4h ago   14d4h ago
eb902ca8  65177d0c  <redacted>    4        run      running   1mo5d ago   1mo5d ago
8c7c793f  65177d0c  <redacted>    4        run      running   1mo17d ago  1mo5d ago
6e08badb  65177d0c  <redacted>    4        run      running   1mo17d ago  1mo5d ago
613693f0  65177d0c  node-exporter 4        run      running   2mo8d ago   1mo5d ago
09d7de47  65177d0c  cadvisor      4        run      running   2mo8d ago   1mo5d ago
ec8c50e5  65177d0c  <redacted>    1        run      running   2mo8d ago   2mo8d ago
One interesting thing is that the allocated CPU seen in the output above (218800) doesn't match what we see in nomad_client_allocated_cpu (218700). I.e. it differs by 100 Mhz.
We also went through and checked every alloc with nomad alloc status, fetched the task resources, and summed these up. The sum we got was consistent with the output from nomad node status (218800).
Is there anything else you want me to check while (evaluations or something like that) now that we have this state in our cluster?
Hi @tgross,
Just checking back to see if you have any news about this issue? Since my last post we've experienced this issue two more times.
Hi @tgross, I'm experiencing a similar issue with memory oversubscription. I looked at my monitoring system and the problem was already present 2 years ago when I started utilizing Nomad.
Is there any way I can help with this investigation?
Hi again,
Just wanted to give a brief update on our situation. We've updated Nomad several times since the issue was created, and we are now running 1.6.1. From the metrics we keep I can see that this issue hasn't happened once during the last 3 months (we don't keep the Nomad metrics for longer than that).
So from our end, I'd say that this looks fixed, although I'm not sure if it got fixed in 1.4, 1.5, 1.6, or somewhere in between.
Thanks for the update @ostkrok and apologies for not getting back to this earlier. I never was able to quite reproduce the behavior you're seeing. I'm going to close this issue for now but certainly if you encounter it again with a current version we'd be happy to take a look.