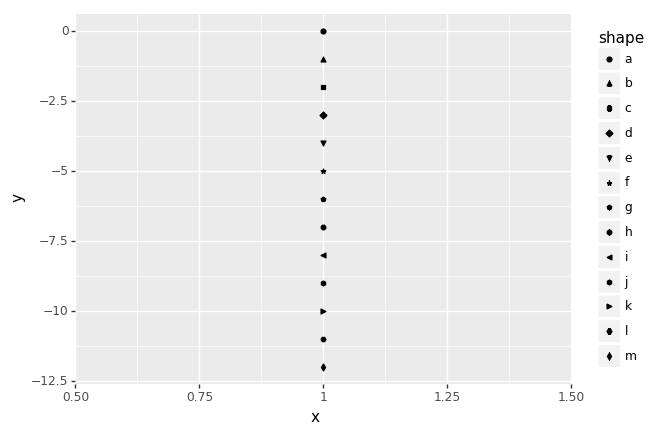
some shapes are rounded in legend
Specifically, the shape c (the square) in the example below seems much rounder in the legend. The triangles b and e have a slightly rounded base, the pendagon g seems like a hexagon and the eliptical h seems more like a circle in the plot. I admitt the resolution is very low but and some form of antialising probably distorts the shapes but I would expect the antializing to effect the legend and plot euqally. At least c could look a lot more like a square.
import numpy as np
import plotnine as pn
n = 13
df = pd.DataFrame({'x':np.ones(n), 'y':-np.arange(n), 'shape':map(chr, range(97, 97+n))})
pn.ggplot(pn.aes('x', 'y', shape='shape'), df) + pn.geom_point()
I know this "bug", it happens at when the sizes are small for.png plots. pdf plots are fine. I think Matplotlib has it too. The issue is the plot uses pathcollections but the legend is made of using Line2d.
I have failed to fix it the times I have tried.
I did some testing and this strange effect only seems to happen with pn.theme(complete=True, dpi=dpi) if 81 < dpi < 115 and ends abruptly if dpi is outside of these bounds. Since the default is dpi=100 it occurred to me a lot. I will work around it by running pn.options.set_option('dpi', 144) or pn.options.set_option('dpi', 72) first.
Thank you for the response! I also tried to track the problem down but did not succeed. I could not even reproduce it in matplotlib:
plt.rcParams['figure.dpi'] = 100
fig, ax = plt.subplots(1, 1)
size = 3
line = Line2D([.5], [.5], marker='s', markersize=size)
ax.add_line(line)

import matplotlib.pyplot as plt
from matplotlib.lines import Line2D
from matplotlib.offsetbox import AnchoredOffsetbox, DrawingArea
class AnchoredDrawingArea(AnchoredOffsetbox):
def __init__(self, width, height, xdescent, ydescent, loc):
self.da = DrawingArea(width, height, xdescent, ydescent, clip=True) # clip=True, is the problem
super().__init__(loc, child=self.da)
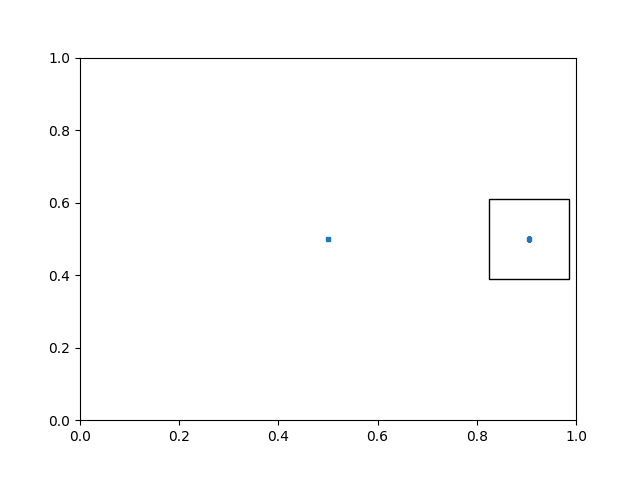
plt.rcParams['figure.dpi'] = 100
fig, ax = plt.subplots(1, 1)
size, stroke = 3, 1
line = Line2D([25], [25], marker='s', markersize=size, markeredgewidth=stroke)
line2 = Line2D([.5], [.5], marker='s', markersize=size, markeredgewidth=stroke)
ada = AnchoredDrawingArea(50, 50, 0, 0, loc='center right')
ada.da.add_artist(line)
ax.add_artist(ada)
ax.add_line(line2)
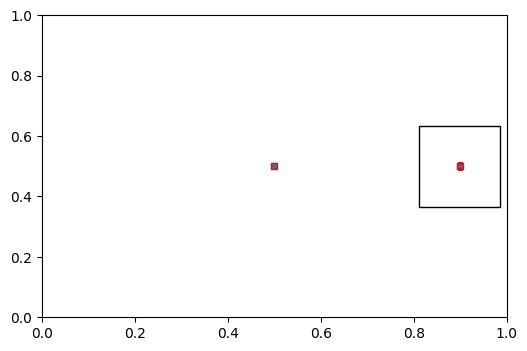
It may be interesting to note that the rounding effect only comes from a strangely shaped edge path. I colored it read and slightly enlarged the makers to demonstrate that:
import matplotlib.pyplot as plt
from matplotlib.lines import Line2D
from matplotlib.offsetbox import AnchoredOffsetbox, DrawingArea

class AnchoredDrawingArea(AnchoredOffsetbox):
    def __init__(self, width, height, xdescent, ydescent, loc):
        self.da = DrawingArea(width, height, xdescent, ydescent, clip=True)  # clip=True, is the problem
        super().__init__(loc, child=self.da)


plt.rcParams['figure.dpi'] = 100
fig, ax = plt.subplots(1, 1)

size, stroke = 5, 1
line = Line2D([25], [25], marker='s', markersize=size, markeredgewidth=stroke, markeredgecolor='red')
line2 = Line2D([.5], [.5], marker='s', markersize=size, markeredgewidth=stroke, markeredgecolor='red')

ada = AnchoredDrawingArea(50, 50, 0, 0, loc='center right')
ada.da.add_artist(line)

ax.add_artist(ada)
ax.add_line(line2)
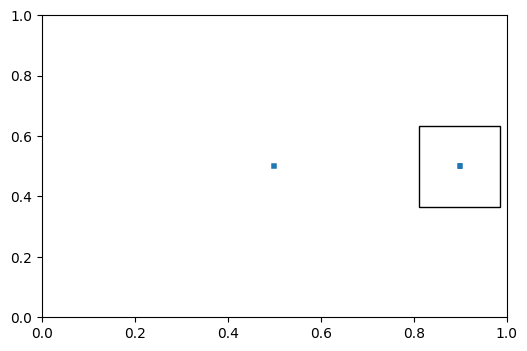
If the stroke is only slightly smaller or larger the issue disappears:
import matplotlib.pyplot as plt
from matplotlib.lines import Line2D
from matplotlib.offsetbox import AnchoredOffsetbox, DrawingArea

class AnchoredDrawingArea(AnchoredOffsetbox):
    def __init__(self, width, height, xdescent, ydescent, loc):
        self.da = DrawingArea(width, height, xdescent, ydescent, clip=True)  # clip=True, is the problem
        super().__init__(loc, child=self.da)


plt.rcParams['figure.dpi'] = 100
fig, ax = plt.subplots(1, 1)

size, stroke = 3, 1.1
line = Line2D([25], [25], marker='s', markersize=size, markeredgewidth=stroke)
line2 = Line2D([.5], [.5], marker='s', markersize=size, markeredgewidth=stroke)

ada = AnchoredDrawingArea(50, 50, 0, 0, loc='center right')
ada.da.add_artist(line)

ax.add_artist(ada)
ax.add_line(line2)
Not sure if this might help: Just adding the line to the plot fixes the issue and does not draw it twice:
import matplotlib.pyplot as plt
from matplotlib.lines import Line2D
from matplotlib.offsetbox import AnchoredOffsetbox, DrawingArea

class AnchoredDrawingArea(AnchoredOffsetbox):
    def __init__(self, width, height, xdescent, ydescent, loc):
        self.da = DrawingArea(width, height, xdescent, ydescent, clip=True)  # clip=True, is the problem
        super().__init__(loc, child=self.da)


plt.rcParams['figure.dpi'] = 100
fig, ax = plt.subplots(1, 1)
ax.set_xlim(0,50)
ax.set_ylim(0,50)

size, stroke = 3, 1
line = Line2D([25], [25], marker='s', markersize=size, markeredgewidth=stroke)
line2 = Line2D([10], [25], marker='s', markersize=size, markeredgewidth=stroke)

ada = AnchoredDrawingArea(50, 50, 0, 0, loc='center right')
ada.da.add_artist(line)

ax.add_artist(ada)
ax.add_line(line2)
ax.add_line(line)
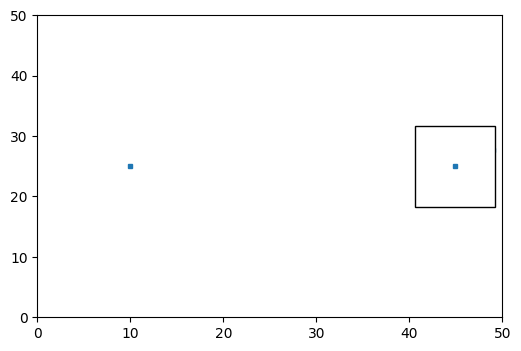
Just adding the line to the plot fixes the issue and does not draw it twice:
The solution has to work for lines that are not added to the axes. The legend is independent of the axes.