Reloads and Latency spike
Detailed Description of the Problem
Reloads with higher number of frontend spikes the latency of requests passing through haproxy
With total 834 number of frontends, reload takes around 3.9 seconds to complete
root@haproxy101:~# grep bind /home/spvignesh01/configs/haproxy.cfg | awk '{print $1,$2}' | wc -l
834
root@haproxy101:~# time systemctl reload haproxy
real    0m3.903s
user    0m0.004s
sys     0m0.003s
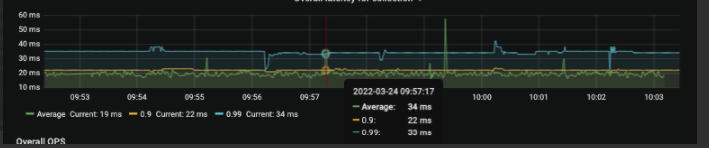
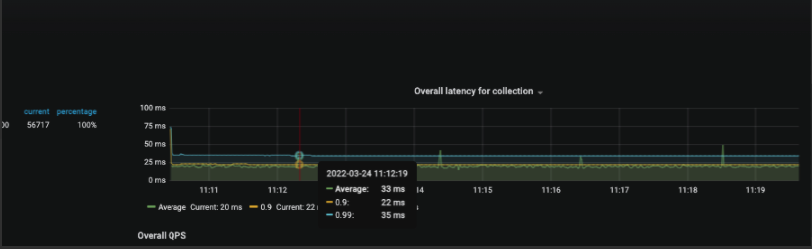
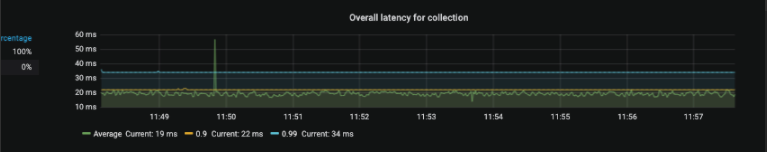
We start to apply a small load on haproxy and keep reloading it every 2 minutes, there is a blip of latency spike everytime reload is done.
Average without reload is 19ms
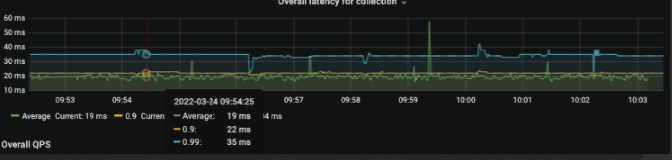
During reload, goes to 30+ ms
Time stamps of reloads
Mar 24 04:29:19 haproxy101 systemd[1]: Reloaded HAProxy.
Mar 24 04:29:15 haproxy101 systemd[1]: Reloading HAProxy.
Mar 24 04:27:15 haproxy101 systemd[1]: Reloaded HAProxy.
Mar 24 04:27:10 haproxy101 systemd[1]: Reloading HAProxy.
Mar 24 04:25:10 haproxy101 systemd[1]: Reloaded HAProxy.
Mar 24 04:25:06 haproxy101 systemd[1]: Reloading HAProxy.
We started gradually reducing the number of frontends.
with 630 frontends, reload takes around the same time, 3.8 seconds and latency spikes
root@haproxy101:~# grep bind /home/spvignesh01/configs/haproxy.cfg | awk '{print $1,$2}' | wc -l
633
root@haproxy101:~# time systemctl reload haproxy

real    0m3.903s
user    0m0.004s
sys     0m0.003s
With keep reducing the numbers by 100, ~400 lbs give optimal results with very little latency.
root@haproxy101:~# grep bind /home/spvignesh01/configs/haproxy.cfg | awk '{print $1,$2}' | wc -l
433
Server Specs
Memory 32G 16 Core E-2278G CPU
Is there any guidelines to number of frontends in a server to have reloads without latency ?
Expected Behavior
Reloads should not cause latency spike
Steps to Reproduce the Behavior
Add ~800 frontends and reload the process while traffic is on.
Do you have any idea what may have caused this?
No
Do you have an idea how to solve the issue?
Have less than 400 Frontends.
What is your configuration?
global
  user haproxy
  group haproxy
  nbproc 1
  nbthread 16
  cpu-map auto:1/1-16 0-15
  log /dev/log local2
  log /dev/log local0 notice
  chroot /path/to/haproxy
  pidfile /path/to/haproxy.pid
  daemon
  master-worker
  maxconn 200000
  hard-stop-after 1h
  stats socket /path/to/stats mode 660 level admin expose-fd listeners
  tune.ssl.cachesize 3000000
  tune.ssl.lifetime 60000
  ssl-default-bind-ciphers ECDHE-ECDSA-AES256-GCM-SHA384:ECDHE-RSA-AES256-GCM-SHA384:ECDHE-ECDSA-CHACHA20-POLY1305:ECDHE-RSA-CHACHA20-POLY1305:ECDHE-ECDSA-AES128-GCM-SHA256:ECDHE-RSA-AES128-GCM-SHA256:ECDHE-ECDSA-AES256-SHA384:ECDHE-RSA-AES256-SHA384:ECDHE-ECDSA-AES128-SHA256:ECDHE-RSA-AES128-SHA256
  ssl-default-bind-options ssl-min-ver TLSv1.2 ssl-max-ver TLSv1.2
  server-state-file /path/to/haproxy_server_states
  tune.bufsize 4096

defaults
  mode http
  log global
  retries 3
  timeout http-request 10s
  timeout queue 10s
  timeout connect 10s
  timeout client 1m
  timeout server 1m
  timeout tunnel 10m
  timeout client-fin 30s
  timeout server-fin 30s
  timeout check 10s
  option httplog
  option forwardfor except 127.0.0.0/8
  option redispatch
  load-server-state-from-file global

frontend load_balancer
        bind x.x.x.x:80 mss 1440 alpn h2,http/1.1
        mode http
        option httplog
        option http-buffer-request
        acl some_acl here
        http-request based on acl
        use_backend busy_server_group if  { be_conn_free(server_group) le 0 }
        default_backend server_group

backend server_group
        mode  http
        option httpchk
        http-check send meth GET uri / ver HTTP/1.1 hdr Host header
        http-check expect status 200
        server my-server01 x.x.x.x:80 check port 80 maxconn 10000 enabled maxqueue 1

        errorfile 503 /path/to/busy/busy.http

backend busy_server_group
        mode http
        option httpchk
        http-check send meth GET uri / ver HTTP/1.1
        http-check expect status 200
        server busy-server busyserver enabled backup
        errorfile 503 /path/to/busy/busy.http
Output of haproxy -vv
HAProxy version 2.4.10-bedf277 2021/12/23 - https://haproxy.org/
Status: long-term supported branch - will stop receiving fixes around Q2 2026.
Known bugs: http://www.haproxy.org/bugs/bugs-2.4.10.html
Running on: Linux 4.15.0-42-generic #45-Ubuntu SMP Thu Nov 15 19:32:57 UTC 2018 x86_64
Build options :
  TARGET  = linux-glibc
  CPU     = generic
  CC      = cc
  CFLAGS  = -O2 -g -Wall -Wextra -Wdeclaration-after-statement -fwrapv -Wno-unused-label -Wno-sign-compare -Wno-unused-parameter -Wno-clobbered -Wno-missing-field-initializers -Wtype-limits -Wshift-negative-value -Wshift-overflow=2 -Wduplicated-cond -Wnull-dereference
  OPTIONS = USE_PCRE=1 USE_LINUX_TPROXY=1 USE_LINUX_SPLICE=1 USE_LIBCRYPT=1 USE_OPENSSL=1 USE_ZLIB=1 USE_SYSTEMD=1 USE_PROMEX=1
  DEBUG   =

Feature list : +EPOLL -KQUEUE +NETFILTER +PCRE -PCRE_JIT -PCRE2 -PCRE2_JIT +POLL -PRIVATE_CACHE +THREAD -PTHREAD_PSHARED +BACKTRACE -STATIC_PCRE -STATIC_PCRE2 +TPROXY +LINUX_TPROXY +LINUX_SPLICE +LIBCRYPT +CRYPT_H +GETADDRINFO +OPENSSL -LUA +FUTEX +ACCEPT4 -CLOSEFROM +ZLIB -SLZ +CPU_AFFINITY +TFO +NS +DL +RT -DEVICEATLAS -51DEGREES -WURFL +SYSTEMD -OBSOLETE_LINKER +PRCTL -PROCCTL +THREAD_DUMP -EVPORTS -OT -QUIC +PROMEX -MEMORY_PROFILING

Default settings :
  bufsize = 16384, maxrewrite = 1024, maxpollevents = 200

Built with multi-threading support (MAX_THREADS=64, default=16).
Built with OpenSSL version : OpenSSL 1.1.1h  22 Sep 2020
Running on OpenSSL version : OpenSSL 1.1.1h  22 Sep 2020
OpenSSL library supports TLS extensions : yes
OpenSSL library supports SNI : yes
OpenSSL library supports : TLSv1.0 TLSv1.1 TLSv1.2 TLSv1.3
Built with the Prometheus exporter as a service
Built with network namespace support.
Built with zlib version : 1.2.11
Running on zlib version : 1.2.11
Compression algorithms supported : identity("identity"), deflate("deflate"), raw-deflate("deflate"), gzip("gzip")
Built with transparent proxy support using: IP_TRANSPARENT IPV6_TRANSPARENT IP_FREEBIND
Built with PCRE version : 8.39 2016-06-14
Running on PCRE version : 8.39 2016-06-14
PCRE library supports JIT : no (USE_PCRE_JIT not set)
Encrypted password support via crypt(3): yes
Built with gcc compiler version 7.3.0

Available polling systems :
      epoll : pref=300,  test result OK
       poll : pref=200,  test result OK
     select : pref=150,  test result OK
Total: 3 (3 usable), will use epoll.

Available multiplexer protocols :
(protocols marked as <default> cannot be specified using 'proto' keyword)
              h2 : mode=HTTP       side=FE|BE     mux=H2       flags=HTX|CLEAN_ABRT|HOL_RISK|NO_UPG
            fcgi : mode=HTTP       side=BE        mux=FCGI     flags=HTX|HOL_RISK|NO_UPG
       <default> : mode=HTTP       side=FE|BE     mux=H1       flags=HTX
              h1 : mode=HTTP       side=FE|BE     mux=H1       flags=HTX|NO_UPG
       <default> : mode=TCP        side=FE|BE     mux=PASS     flags=
            none : mode=TCP        side=FE|BE     mux=PASS     flags=NO_UPG

Available services : prometheus-exporter
Available filters :
	[SPOE] spoe
	[CACHE] cache
	[FCGI] fcgi-app
	[COMP] compression
	[TRACE] trace
Last Outputs and Backtraces
No response
Additional Information
No response
3.9 seconds seems very long for a restart. I've tested with a config having 33000 backends (each with one server) and it takes only 0.26 second on my laptop. I'm not seeing anything big in your config extracts, maybe you're using a large number of certificates that require lots of crypto processing on startup ?
If it's the startup time that takes a lot of CPU, the problem is simply that the CPU cycles used by the new process are stolen from the threads of the running one, and these are the ones responsible for the latency. In this case, a nice approach could be to bind the workers on all CPUs but one and keep the remaining one for other
tasks on the machine, including the reloading process. You could for example use nbthread 15 and cpu-map 1/1-15 1-15, but always start your process under taskset -c 0. This way all the heavy crypto stuff at boot is performed on CPU zero while CPUs 1-15 are used for the traffic.
@wtarreau Thanks for the help as always.
We have 53 certificates in total, and these 53 are assigned to 183 https frontends in haproxy, rest are http/tcp frontends.
I changed all of the https frontends to http with no tls references, the reload still takes the same time.
With same number of frontends (~800), I changed the backends to exactly have only one server, this time the reload only took ~0.8 secs.
I think rather number of frontends/certs, number of backend servers could be a problem? we load 107941 servers through server-template dns discovery. (not exactly 107941, but if we add all template size, the total comes to this)
OK that makes sense then. You're loading 3 times more servers than me and retrieving their state from a state file, that's clearly where the CPU usage is located. Indeed, at a moment or another, someone needs to allocate and configure these 100k servers and look their state up in the file. So if we consider that this CPU usage is normally high, then it makes sense to try to better dedicate CPU to that task.
You're just making me think that we could imagine renicing the process once started. It could be useful to start under nice +10 during parsing, and switch back to nice 0 once ready. Maybe that could help in your case. If that's something you're interested in trying, I can possibly try to hack a dirty patch to try this, just let me know.
OK, please give the attached one a try. It's not finished of course but it would be nice to know if it provides any benefit. You'll have to add something like the following at the top of your global section:
        tune.priority.startup 15
        tune.priority.runtime 0
Note that you need the process to start privileged otherwise it will not be able to restore the original priority. 0001-WIP-set-runtime-nice.patch.txt
Thank you for the quick patch, I tried this, but I'm afraid I didn't see much difference in the latency spike during reloads.
About starting the process with privileges, do I need to so anything extra to do this? We already start the process as root and I have changed the user and group to root in the global config.
Yes it was enough to start it as root as you did. Otherwise you'd have noticed a warning anyway.
Then I really encourage you to try what I suggested last week and keep one CPU available for parsing and reloads.
@wtarreau sure, I will give it a try.
BTW, if not too much, I'd like to ask if there are any plans in roadmap to add reloadless configurations on haproxy. Like the Envoy proxy.
That's what has been worked on over the last few years. For example since 2.5 we now have full support for creating or deleting servers on the fly without reloading. But you have to understand that a config first and foremost defines an environment, a context and limitations that by definitions are definitive for a process and that a number of elements will never be possible to change without replacing the process. Others are theoretically possible but would require so much complexity that they would totally ruin haproxy's performance, and if you'd be willing to give up on 90% of its performance for more flexibility, probably that you'd already have chosen other solutions :-) But we're still continuing in this trend of making certain things more and more dynamic. It's extremely complicated because the vast majority of the core features are the result of a well-defined and consistent configuration that gets optimized at end of parsing before booting.
@wtarreau understood, thank you so much for the explanation !
BTW, since we have abount 800 frontends and backends, and every server template has room size of 30 but they may not receive 30 servers from the DNS resolution. We stripped off the empty lines from statefile and start loading it, it appears to reduce the latency during reloads.
Yeah that's indeed possible. Older versions of the state file have been known for facing O(N^3) complexity... Now I think it's around N*log(N) or N^2, I don't remember. One approach that works (but that would likely be a pain to deal with) is to split the file per backend so that each backend reads a smaller part. It used to be a great time saver in the past, I think it's less of it nowadays.
I'm marking as "works as designed" because it's related to the cost of processing the state file, that doesn't mean we shouldn't do anything to improve it though, but there's hardly anything that can be done at this point.
@wtarreau sorry to bother you.
We were just exploring haproxy code base and followed the pattern written for cli to make changes to haproxy. we added a new command to add a listener.
#echo "help" | nc -U /var/lib/haproxy/stats | grep "add frontend"
 add frontend name/bind                    : adds a new frontend

#ip addr add 4.4.4.4/32 dev tunl0
#ss -antp | grep 4.4.4.4
echo "add frontend test1 4.4.4.4:80" | nc -U /var/lib/haproxy/stats

#ss -antp | grep 4.4.4.4
LISTEN      0        1024                                        4.4.4.4:80                                                0.0.0.0:*                             users:(("haproxy",pid=215370,fd=87))
We understand this is a complex task, but apart from complexity, we would like to understand your comment on its performance impact.
if you'd be willing to give up on 90% of its performance
Could you let us know touching/bending what part of codebase will affect performance to drop by 90%? is this tested? If not, we would like to modify this and give it try. Maybe like a flag to enable this only if this feature is required.
Please let us know your thoughts.