New Grid _ East Asia
Hello,
This grid is for my school project. I am quantifying the military forces in East/SE Asia. "Code" is the military theater to be equal to one grid square: China has 4 military theater commands; FEMD is Russia's Far East Military District; Japan is split in 4, including Okinowa; South Korea, North Korea, Philippines, Guam and the US 7th Fleet are all considered to be one grid. And then the number of military forces in each square are the numbers.
I am not sure if this is the right way to pose the information but it seems to show me what I want in the preview screen before this.
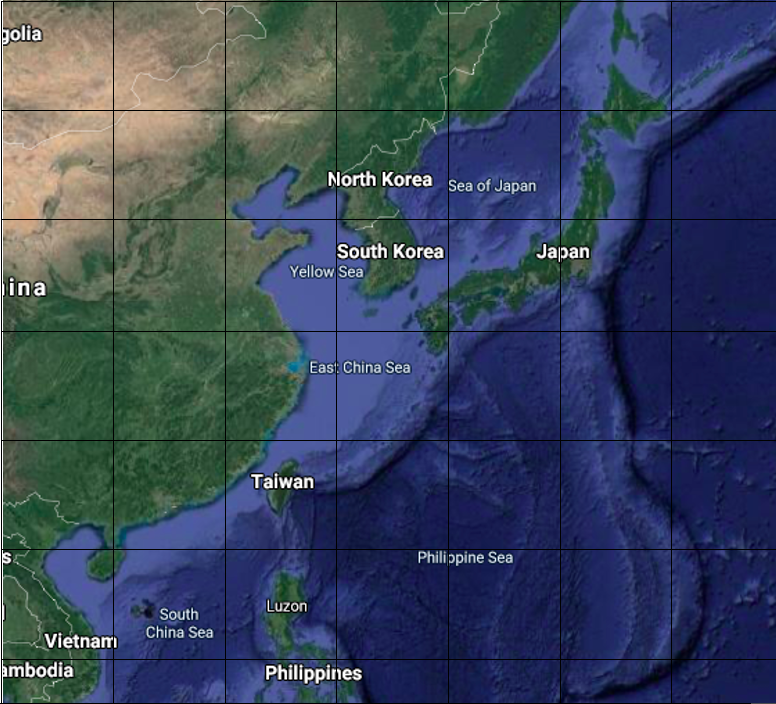
I have included a link to Google Maps, that I think shows the region I'm talking about well. I'm not sure who I am writing to here, or what I should ask for, but I would appreciate your help in bringing this vision to life. Please ask me if you have any more questions! Thanks a bunch.
This is what the Geo Grid Designer R-code: mygrid <- data.frame( Code = c("FEMD", "JPN", "NK", "NTC", "JPT", "CTC", "SK", "JPS", "OK", "ETC", "TW", "STC", "US7", "PH", "SCSP", "SCSS", "USG"), US = c("0", "5000", "0", "0", "25000", "0", "28500", "10000", "25000", "0", "0", "0", "20000", "0", "7500", "7500", "12000"), CN = c("0", "0", "0", "200000", "0", "200000", "0", "0", "0", "325000", "0", "200000", "0", "0", "700", "2000", "0"), TW = c("0", "0", "0", "0", "0", "0", "0", "0", "0", "0", "165000", "0", "0", "3000", "0", "0", "0"), SK = c("0", "0", "0", "0", "0", "0", "580000", "0", "0", "0", "0", "0", "0", "0", "0", "0", "0"), NK = c("0", "0", "1280000", "0", "0", "0", "0", "0", "0", "0", "0", "0", "0", "0", "0", "0", "0"), JP = c("0", "50000", "0", "0", "70000", "0", "0", "120000", "10000", "0", "0", "0", "0", "0", "0", "0", "0"), RU = c("175000", "3500", "0", "0", "0", "0", "0", "0", "0", "0", "0", "0", "0", "0", "0", "0", "0"), PH = c("0", "0", "0", "0", "0", "0", "0", "0", "0", "0", "0", "0", "0", "125000", "0", "0", "0"), row = c(1, 1, 2, 2, 2, 3, 3, 3, 4, 4, 5, 5, 5, 6, 6, 7, 7), col = c(4, 5, 3, 2, 5, 1, 3, 4, 3, 2, 2, 1, 4, 2, 1, 1, 7), stringsAsFactors = FALSE ) geofacet::grid_preview(mygrid) Grid data:
Code,US,CN,TW,SK,NK,JP,RU,PH,row,col
FEMD,0,0,0,0,0,0,175000,0,1,4
JPN,5000,0,0,0,0,50000,3500,0,1,5
NK,0,0,0,0,1280000,0,0,0,2,3
NTC,0,200000,0,0,0,0,0,0,2,2
JPT,25000,0,0,0,0,70000,0,0,2,5
CTC,0,200000,0,0,0,0,0,0,3,1
SK,28500,0,0,580000,0,0,0,0,3,3
JPS,10000,0,0,0,0,120000,0,0,3,4
OK,25000,0,0,0,0,10000,0,0,4,3
ETC,0,325000,0,0,0,0,0,0,4,2
TW,0,0,165000,0,0,0,0,0,5,2
STC,0,200000,0,0,0,0,0,0,5,1
US7,20000,0,0,0,0,0,0,0,5,4
PH,0,0,3000,0,0,0,0,125000,6,2
SCSP,7500,700,0,0,0,0,0,0,6,1
SCSS,7500,2000,0,0,0,0,0,0,7,1
USG,12000,0,0,0,0,0,0,0,7,7
This looks pretty interesting! The google map link you added was mangled by github and is not working. Is there another image online somewhere that we can link to (or copy & paste) so that we can have a reference image for this grid? Thanks
Hi stedy,
Thanks for your help. I hope these maps I attached can help. The first is a word doc with where I would put the boxes (more or less). And the second is a png file with just my estimated grid lines.