new grid: 'Romania_judete'
Grid map of Romanian counties (judete)
[[Note: To help streamline the process of adding this grid, please replace this text with an image of a map for the region for reference. Also, please check the ISO_3166-2 (https://en.wikipedia.org/wiki/ISO_3166-2) codes if your grid uses countries or states/provinces. Finally, if you can provide an example of your grid in action with a data set and sample code, that would be great but is not required.]]
Grid data:
"name","code","row","col"
"Alba","AB",3,3
"Arad","AR",3,2
"Arges","AG",5,4
"Bacau","BC",3,6
"Bihor","BH",2,2
"Bistrita Nasaud","BN",2,5
"Botosani","BT",1,7
"Brasov","BV",4,4
"Braila","BR",5,7
"Buzau","BZ",5,6
"Caras Severin","CS",5,1
"Calarasi","CL",7,6
"Cluj","CJ",2,4
"Constanta","CT",6,8
"Covasna","CV",4,5
"Dambovita","DB",6,4
"Dolj","DJ",7,3
"Galati","GL",4,7
"Giurgiu","GR",7,5
"Gorj","GJ",5,2
"Harghita","HR",3,5
"Hunedoara","HD",4,2
"Ialomita","IL",6,7
"Iasi","IS",2,7
"Ilfov","IF",6,6
"Maramures","MM",1,4
"Mehedinti","MH",6,2
"Mures","MS",3,4
"Neamt","NT",2,6
"Olt","OT",6,3
"Prahova","PH",5,5
"Satu Mare","SM",1,3
"Salaj","SJ",2,3
"Sibiu","SB",4,3
"Suceava","SV",1,6
"Teleorman","TR",7,4
"Timis","TM",4,1
"Tulcea","TL",5,8
"Vaslui","VS",3,7
"Valcea","VL",5,3
"Vrancea","VR",4,6
"Bucuresti","B",6,5
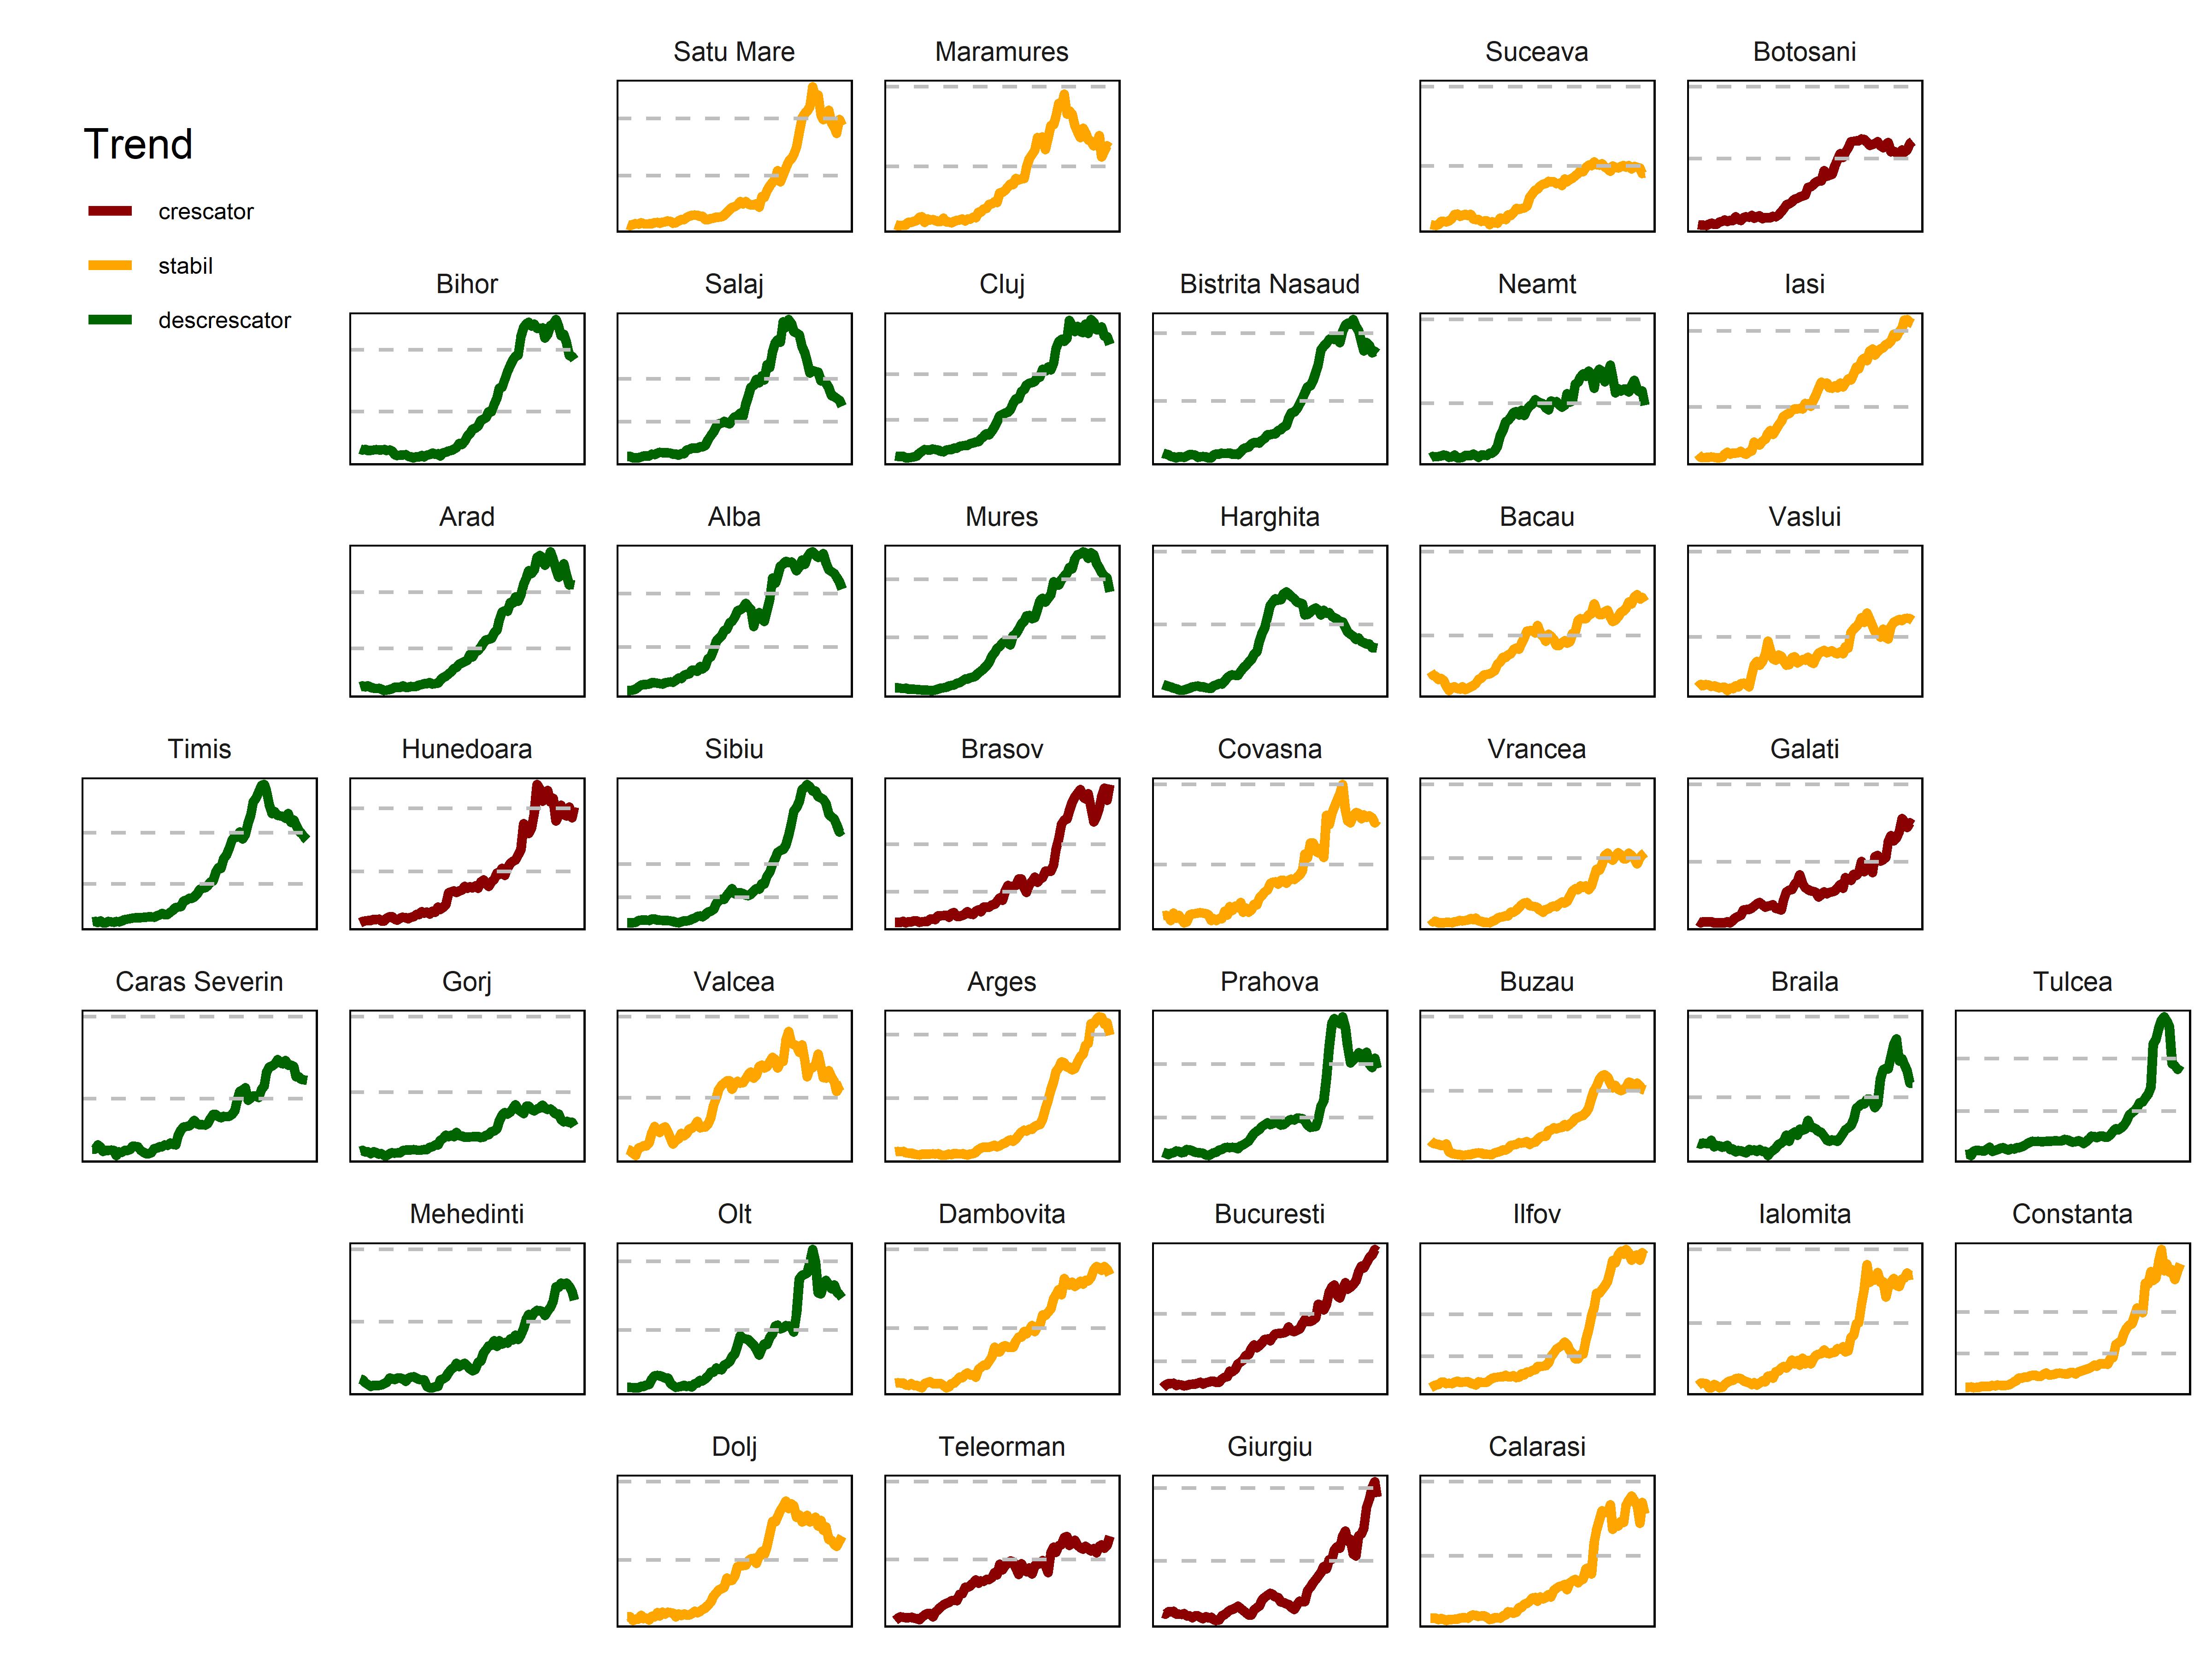
7-day incidence of SARS-COV2 cases in each Romanian county (as of Nov 26, 2020)
data snippet:
print(subset(dfJ2,county_id %in% c('AB','GR','IS'))[700:717,c(1:5,9,10)]) county_id county_name county_population total_cases reporting_date MA7 trend 9787 AB Alba 323778 8833 2020-11-21 169.71429 descrescator 9805 GR Giurgiu 263194 3375 2020-11-21 81.85714 crescator 9810 IS Iasi 791665 17150 2020-11-21 338.28571 stabil 9829 AB Alba 323778 8974 2020-11-22 166.85714 descrescator 9847 GR Giurgiu 263194 3515 2020-11-22 98.14286 crescator 9852 IS Iasi 791665 17462 2020-11-22 344.57143 stabil 9871 AB Alba 323778 9036 2020-11-23 164.85714 descrescator 9889 GR Giurgiu 263194 3603 2020-11-23 104.28571 crescator 9894 IS Iasi 791665 17742 2020-11-23 363.57143 stabil 9913 AB Alba 323778 9169 2020-11-24 159.85714 descrescator 9931 GR Giurgiu 263194 3691 2020-11-24 113.28571 crescator 9936 IS Iasi 791665 18086 2020-11-24 364.85714 stabil 9955 AB Alba 323778 9363 2020-11-25 154.28571 descrescator 9973 GR Giurgiu 263194 3793 2020-11-25 117.85714 crescator 9978 IS Iasi 791665 18476 2020-11-25 358.14286 stabil 9997 AB Alba 323778 9499 2020-11-26 144.71429 descrescator 10015 GR Giurgiu 263194 3859 2020-11-26 106.00000 crescator 10020 IS Iasi 791665 18863 2020-11-26 355.00000 stabil
ggplot(subset(dfJ2,dates>=max(dfJ$dates)-backDays), aes(x=dates,y=MA7/county_population10^57,color=trend))+ facet_geo(~county_name,grid=dfGrid,scales='free_y')+ geom_path(size=1.2)+ scale_y_continuous("")+ scale_x_date(breaks='2 weeks',limits=c(max(dfJ$dates)-backDays,max(dfJ$dates)))+ scale_color_manual('Trend',values=c('crescator'='darkred','stabil'='orange','descrescator'='darkgreen'))+ theme_bw()+ geom_hline(yintercept=c(150,300),color='grey',linetype=2)+ theme(axis.title.x = element_blank(), axis.text.y = element_blank(), axis.ticks.y = element_blank(), strip.text.x = element_text(size = 7), axis.text.x = element_blank(), axis.ticks.x = element_blank(), panel.grid = element_blank(), legend.position=c(0.05,0.9), legend.key.size = unit(0.5, "cm"), legend.text=element_text(size=6), strip.background = element_blank(), panel.border = element_rect(colour = "black", fill = NA) )