wave

wave copied to clipboard
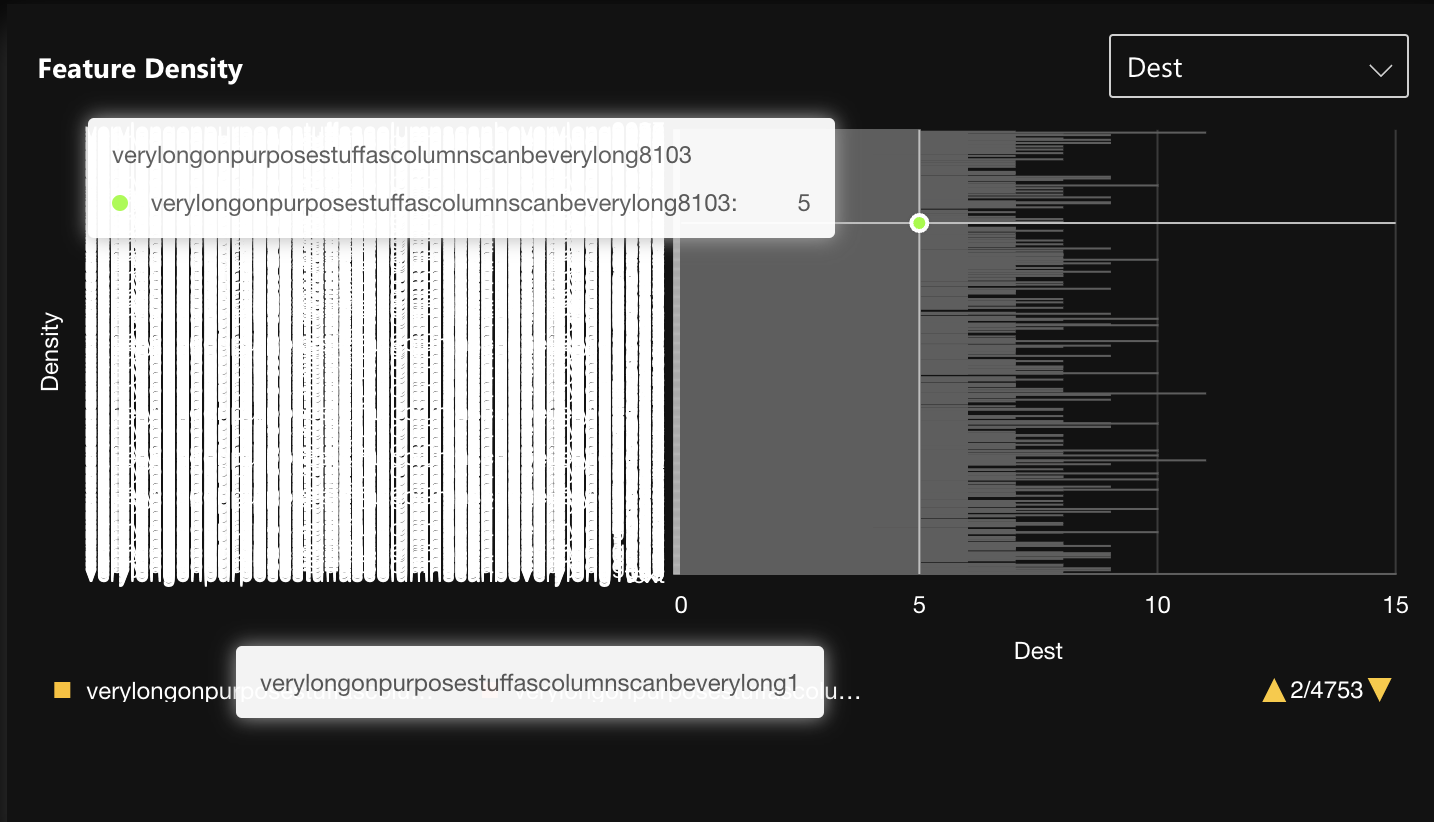
Large number of data points make "interval" plot un usable
Wave SDK Version, OS
0.21.1, macOS 12.5
Actual behavior
(A clear and concise description of what happened.)
Showing a large number of points in an "interval" type table makes it slow for interactions=["brush"] and visually un-usable
Expected behavior
(A clear and concise description of what you expected to happen.) Option 1: hide labels for a large number of labels and only show labels when there is enough space after zooming in Option 2: Make the plot scrollable so users can scroll and see their desired data point
Steps To Reproduce
code used (it's not possible to include a large number of data points here)
ui.visualization(
        plot=ui.plot(
            [
                ui.mark(
                    type="interval",
                    x="=x",
                    x_title="x_label",
                    y_min=0,
                    y="=y",
                    y_title="y_label",
                    color="=x",
                    label_overlap="hide",
                )
            ]
        ),
        data=data(
            fields=["x", "y"],
            pack=True,
            rows=[
                (
                    float(p.x_coordinate),
                    p.y_coordinate,
                )
                for p in points
            ],
        ),
        interactions=["brush"],
    )