Add Min and Max options
This PR adds a couple of options to set the min and max values of the Y axis.
I needed them for a personal project and figured it might be useful to other people.
Pull Request Test Coverage Report for Build 42
- 10 of 10 (100.0%) changed or added relevant lines in 2 files are covered.
- No unchanged relevant lines lost coverage.
- Overall coverage increased (+0.8%) to 79.921%
| Totals | |
|---|---|
| Change from base Build 47: | 0.8% |
| Covered Lines: | 203 |
| Relevant Lines: | 254 |
💛 - Coveralls
Pull Request Test Coverage Report for Build 5349798357
- 10 of 10 (100.0%) changed or added relevant lines in 2 files are covered.
- No unchanged relevant lines lost coverage.
- Overall coverage increased (+0.1%) to 96.037%
| Totals | |
|---|---|
| Change from base Build 5302804267: | 0.1% |
| Covered Lines: | 315 |
| Relevant Lines: | 328 |
💛 - Coveralls
I've been using this fork myself recently and can attest to its robustness. Let's get this baby merged!
Hi, @carlosms thanks for the PR :octocat: :heart:
These options are definitely needed, here I'm little skeptical about the name of the options. They actually mean MinLower, MinUpper; if possible, can we think of name other than Min & Max.
:wave: @jesseduffield would like to have your views on this.
Naming is hard! Jeff Atwood's tweet :smile:
@guptarohit I'm not sure why MinLower and MinUpper are more correct. Do you mean MaxUpper?
What about LowerBound and UpperBound:
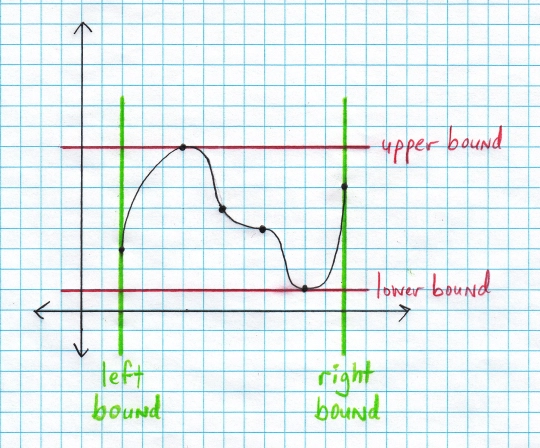
Although technically that's referring to data points on the graph.. damn.
This is tricky because as the end-user, the names which are most intuitive are coincidentally names that don't map well onto the actual terminology.
What about WindowMax and WindowMin?
@jesseduffield if I understand correctly these options ensure the minimum lower bound of the graph (therefore MinLower) & minimum upper bound of the graph(therefore MinUpper), as L64
It will be ignored if the series contains a bigger value.
Whereas, MaxUpper or Max appear like it would set the max possible point on the graph. Please correct me if I'm wrong.
@guptarohit I'm not quite sure what you mean. Do you want to use MinLower and MaxUpper or MinLower and MinUpper?
These comments don't seem to be cohesive:
They actually mean MinLower, MinUpper maximum upper bound of the graph(therefore MaxUpper) MaxUpper or Max appear like it would set the max possible point on the graph.
At any rate, I'm find with MinLower and MaxUpper
hi @jesseduffield, I actually meant MinLower and MinUpper (edited my comment now, please check)
@guptarohit I am still a little confused. Lets say that we're using this PR's terminology, and I set Min to 0 and Max to 10, but then my data set ranges from -10 to 20. The lowest value on the graph will be 0 and the highest value will be 10. I'm not sure why the Max would be better named MinUpper in that case
@jesseduffield I'm afraid it won't be like that as per this PR, please check the test case #16 or check the O/P by following example:
data := []float64{-2, 1, 11, 2, -10, 5, 7, 11, -9, -4, -1, 5, 13, -2}
asciigraph.Plot(data, asciigraph.Min(0), asciigraph.Max(10))
  15.00 ┤       ╭╮
  14.00 ┤       ││
  13.00 ┤       ││  ╭╮
  12.00 ┤       ││  ││
  11.00 ┤ ╭╮   ╭╯│  ││
  10.00 ┤ ││   │ │  ││
   9.00 ┤ ││   │ │  ││
   8.00 ┤ ││   │ │  ││
   7.00 ┤ ││  ╭╯ │  ││
   6.00 ┤ ││  │  │  ││
   5.00 ┼ ││ ╭╯  │ ╭╯│
   4.00 ┤ ││ │   │ │ │
   3.00 ┤ ││ │   │ │ │
   2.00 ┤ │╰╮│   │ │ │
   1.00 ┤╭╯ ││   │ │ │
   0.00 ┤│  ││   │ │ │
  -1.00 ┤│  ││   │╭╯ │
  -2.00 ┼╯  ││   ││  ╰
  -3.00 ┤   ││   ││
  -4.00 ┤   ││   ││
  -5.00 ┤   ││   ││
  -6.00 ┤   ││   ││
  -7.00 ┤   ││   ││
  -8.00 ┤   ││   ││
  -9.00 ┤   ││   ╰╯
 -10.00 ┤   ╰╯
That's strange, I'm not really sure whether Min or Max are having any effect at all there. I would have expected it to have a max y-axis value of 10, and a min of 0. @carlosms is the above example an expected output?
Updated options names to LowerBound and UpperBound. This PR also resolves #26