grpc-go
 grpc-go copied to clipboard
Dial failure will cause memory peak
Please see the FAQ in our main README.md, then answer the questions below before submitting your issue.
What version of gRPC are you using?
1.29.1
What version of Go are you using (go version)?
1.17
What operating system (Linux, Windows, …) and version?
Linux
What did you do?
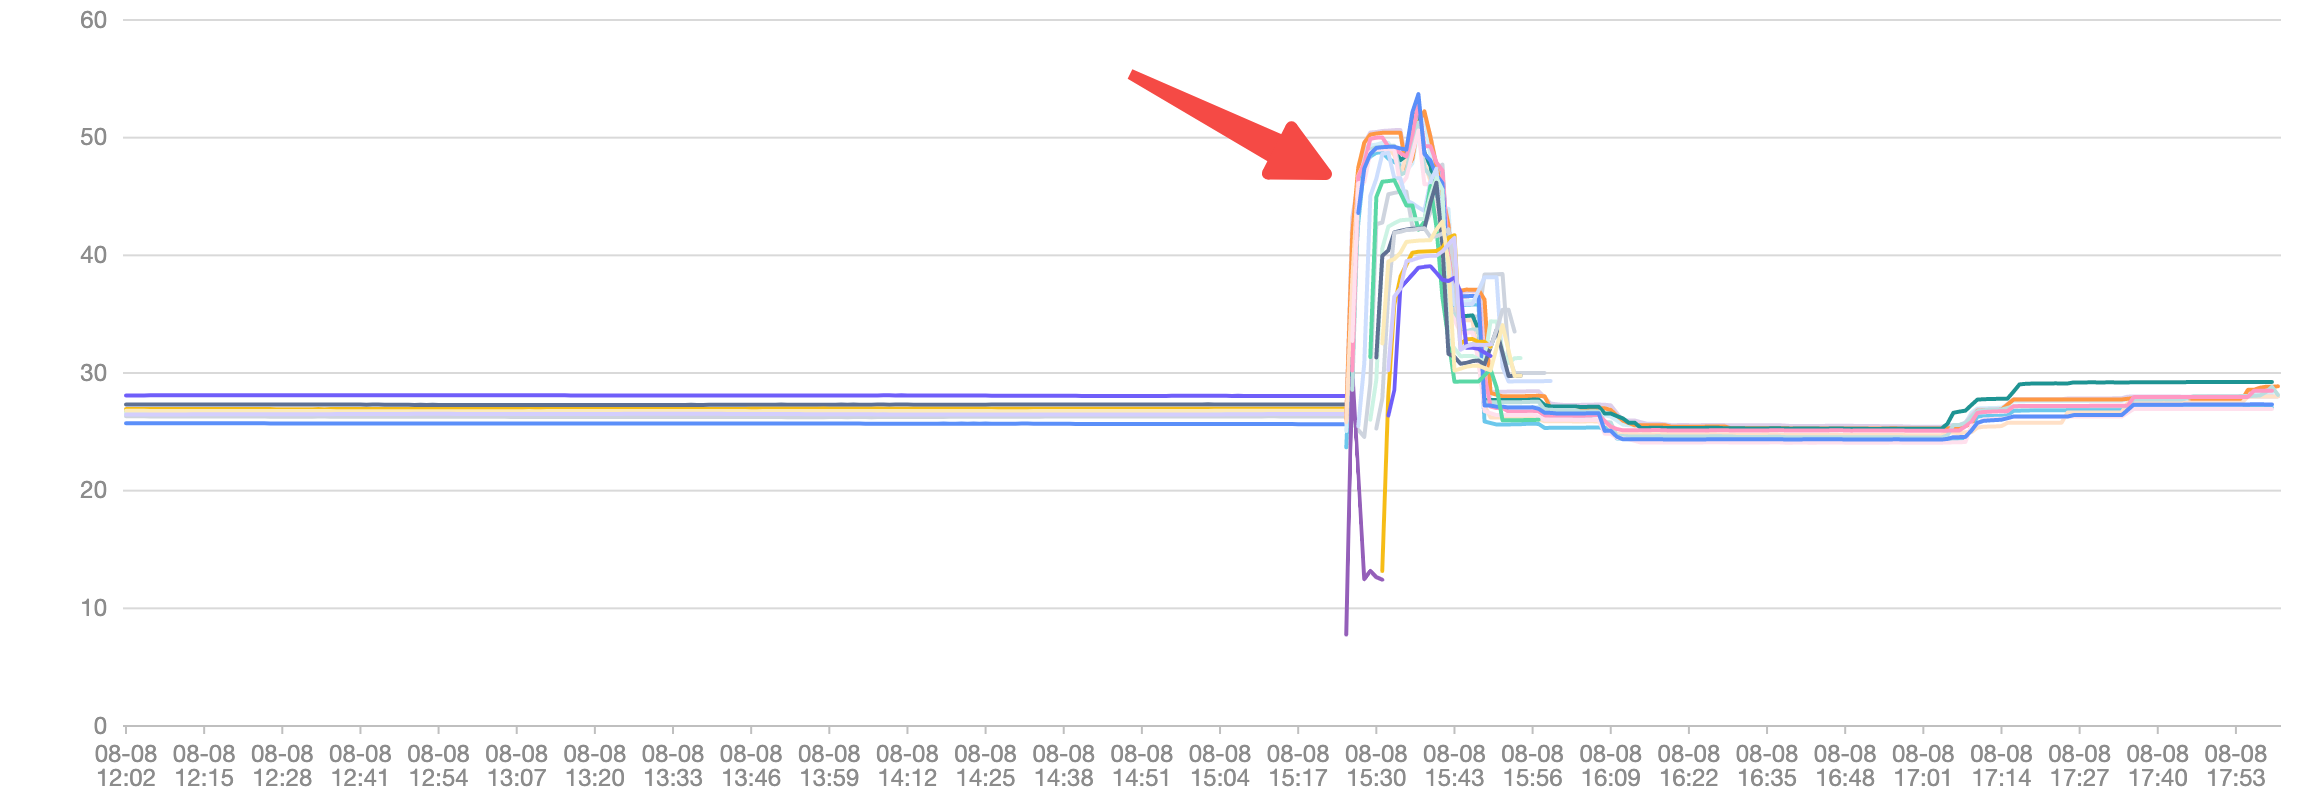
When network issue occurs, our app will eat more memory than expected
What did you expect to see?
Dial error should not cause memory spike
What did you see instead?
heap profile: 991: 52360048 [62272: 866446440] @ heap/1048576
526: 34471936 [4983: 326565888] @ 0x89e22c 0x89e1a5 0x88741a 0x9093a4 0x90929b 0x908bd5 0x908167 0x469301
#       0x89e22b        google.golang.org/grpc/internal/transport.newBufWriter+0xeb             /home/jenkins/agent/workspace/epb-21689/vendor/google.golang.org/grpc/internal/transport/http_util.go:612
#       0x89e1a4        google.golang.org/grpc/internal/transport.newFramer+0x64                /home/jenkins/agent/workspace/epb-21689/vendor/google.golang.org/grpc/internal/transport/http_util.go:665
#       0x887419        google.golang.org/grpc/internal/transport.newHTTP2Client+0x759          /home/jenkins/agent/workspace/epb-21689/vendor/google.golang.org/grpc/internal/transport/http2_client.go:249
#       0x9093a3        google.golang.org/grpc/internal/transport.NewClientTransport+0x463      /home/jenkins/agent/workspace/epb-21689/vendor/google.golang.org/grpc/internal/transport/transport.go:581
#       0x90929a        google.golang.org/grpc.(*addrConn).createTransport+0x35a                /home/jenkins/agent/workspace/epb-21689/vendor/google.golang.org/grpc/clientconn.go:1272
#       0x908bd4        google.golang.org/grpc.(*addrConn).tryAllAddrs+0x384                    /home/jenkins/agent/workspace/epb-21689/vendor/google.golang.org/grpc/clientconn.go:1195
#       0x908166        google.golang.org/grpc.(*addrConn).resetTransport+0x236                 /home/jenkins/agent/workspace/epb-21689/vendor/google.golang.org/grpc/clientconn.go:1110
When network issue occurs, our app will eat more memory than expected
How much memory did you expect your app to consume, and how much did it end up consuming?
Dial error should not cause memory spike
Dial is an expensive operation since it sets up a lot of things on the ClientConn. Given that the memory consumption came back down in your graph in about ~30s, why is this an issue?
Also, you are on gRPC version 1.29.0, which is more than 2 years old. Is updating to a newer gRPC version an option for you?
This issue is labeled as requiring an update from the reporter, and no update has been received after 6 days. If no update is provided in the next 7 days, this issue will be automatically closed.